Categories: Technical analysis

Alibaba Wave Analysis – 24 June, 2020

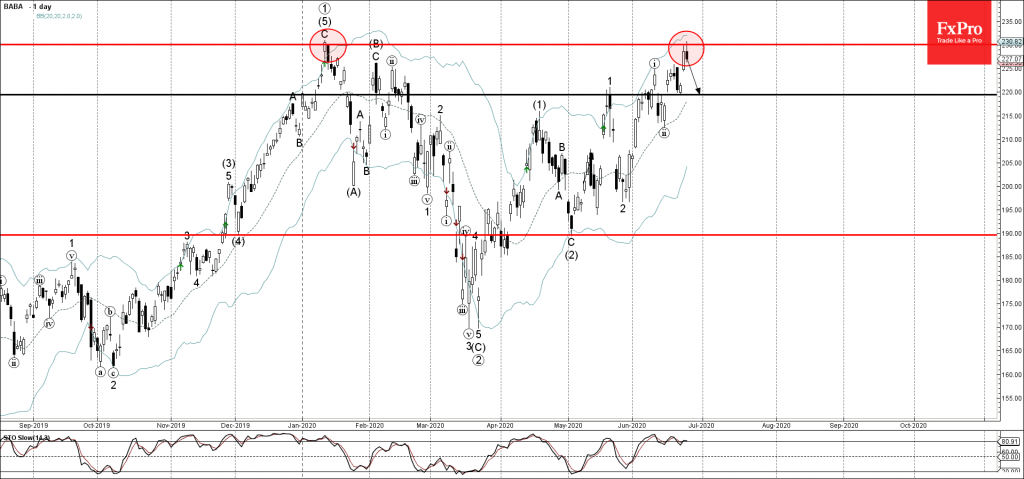
• Alibaba reversed from resistance level 230.00

• Likely to fall to 220.00

Alibaba group recently reversed down from the multi-month resistance level 230.00 (which stopped the extended daily uptrend at the start of this year) – strengthened by the upper daily Bollinger band.

The downward reversal from this resistance level stopped the earlier short-term impulse wave (iii) from the middle of June. Given the overbought reading on the daily Stochastic indicator – Alibaba group is likely to fall further toward the next support level 220.00 (low of the previous minor correction).   


The FxPro Tech Analysis Team

The FxPro technical experts prepare a daily analysis of the most active currency pairs (majors, crosses, exotics) and commodities. Selected instruments are reviewed on daily trends (D1, H4), using the active Elliott Wave setups, Japanese candlesticks, indicators, and support/resistance levels.

Share
Published by
The FxPro Tech Analysis Team
Tags: BABA

Recent Posts

Top 10 Forex Trading Strategies

We have outlined the 10 best forex trading strategies with clear logic, real-world context, and…

24 minutes ago

Bitcoin has not crossed the correction line

Bitcoin holds near $95.5K as the market steadies but hasn't confirmed a exit from correction…

33 minutes ago

CHFJPY Wave Analysis – 15 January 2026

CHFJPY: ⬇️ Sell - CHFJPY reversed from resistance zone - Likely to fall to support level…

13 hours ago

WTI Crude Oil Wave Analysis – 15 January 2026

WTI Crude Oil: ⬇️ Sell - WTI Crude Oil rising inside minor impulse wave (1) -…

13 hours ago

Costco Wave Analysis – 15 January 2026

Costco: ⬆️ Buy - Costco rising inside minor impulse wave (1) - Likely to reach resistance…

13 hours ago

Chevron Wave Analysis – 15 January 2026

Chevron: ⬆️ Buy - Chevron broke strong resistance level 165.00 - Likely to rise to resistance…

13 hours ago

This website uses cookies