Categories: Technical analysis

Alibaba Wave Analysis – 19 December, 2019

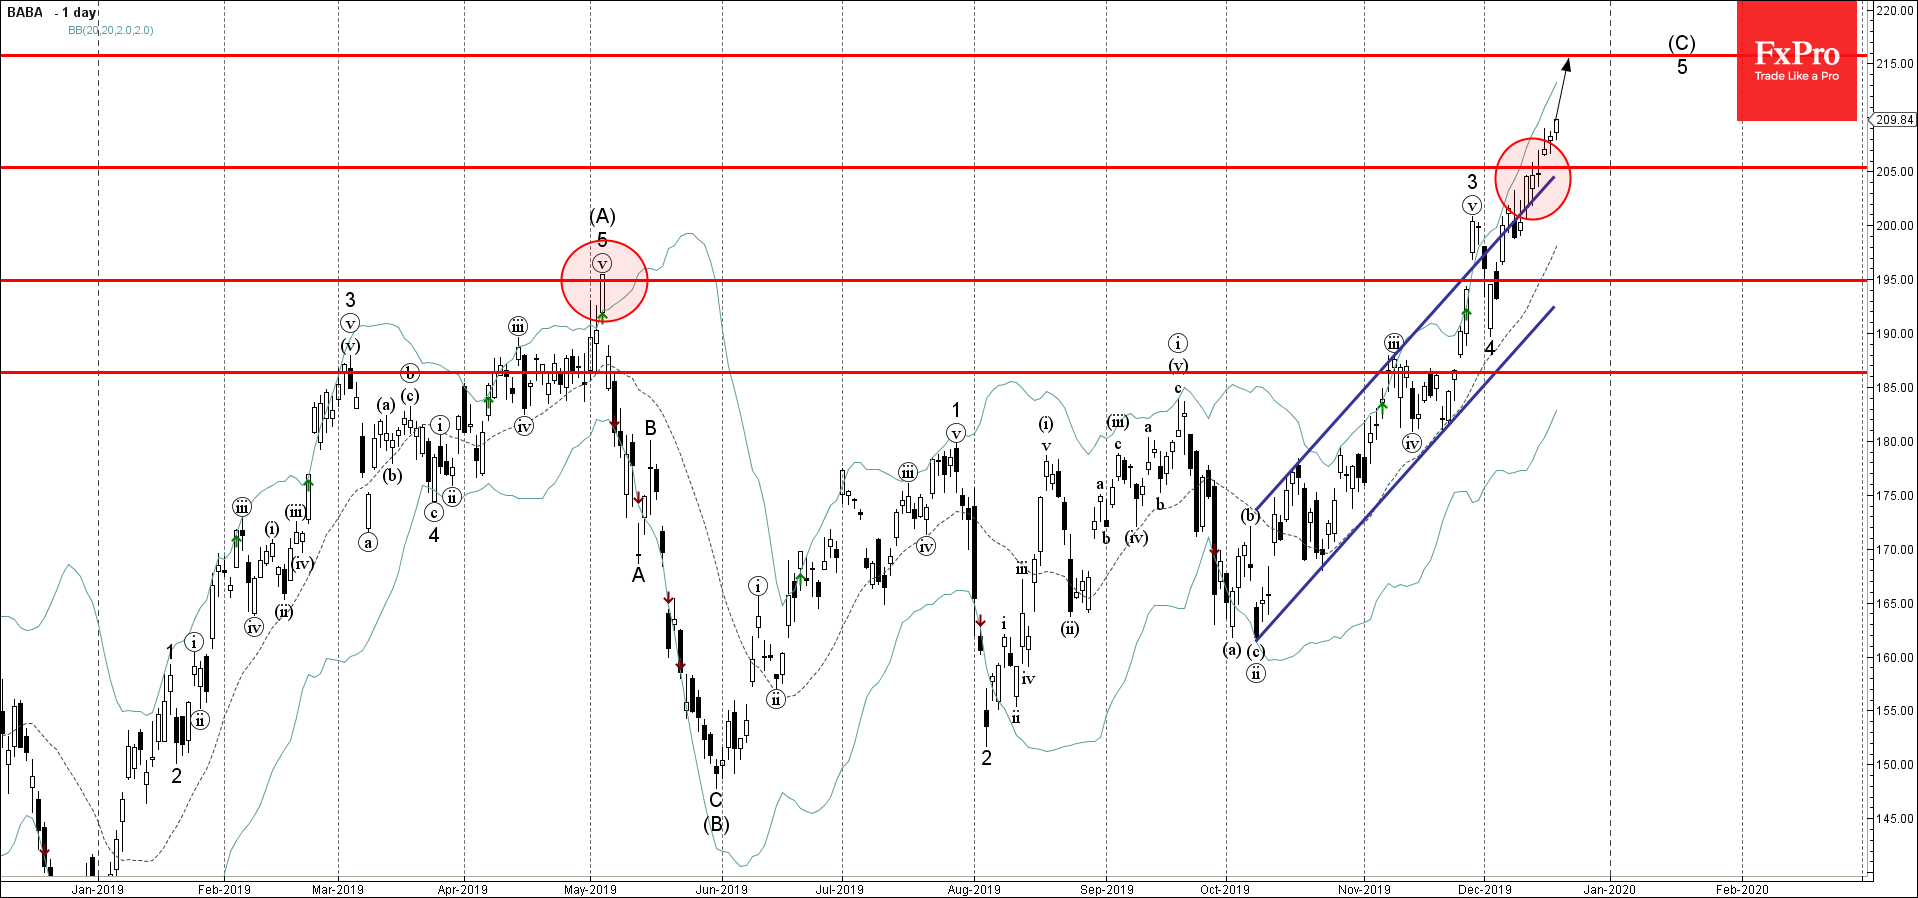
  • Alibaba broke resistance area
  • Likely to rise to 215.00

Alibaba recently broke through the resistance area lying between the key round resistance level 60,00 and the resistance trendline of the daily up channel from the start  for October.

The breakout of this resistance area strengthened the bullish pressure on this instrument.

Given the clear daily uptrend – Alibaba is expected to rise further toward the next resistance level 215.00 (the target for the completion of the active impulse wave (C)).

The FxPro Tech Analysis Team

The FxPro technical experts prepare a daily analysis of the most active currency pairs (majors, crosses, exotics) and commodities. Selected instruments are reviewed on daily trends (D1, H4), using the active Elliott Wave setups, Japanese candlesticks, indicators, and support/resistance levels.

Share
Published by
The FxPro Tech Analysis Team
Tags: BABA

Recent Posts

Forex has set its priorities

In 2026, experts favour the yen, see modest euro growth, and expect pressure on the…

2 hours ago

Bear market rebound in crypto is likely to continue

Crypto rebounds continue; Bitcoin faces resistance, with a mixed market outlook ahead, as regulatory changes…

3 hours ago

Coca-Cola Wave Analysis – 4 December 2025

Coca-Cola: ⬇️ Sell - Coca-Cola reversed from long-term resistance level 73.25 - Likely to fall to…

17 hours ago

DraftKings Wave Analysis – 4 December 2025

DraftKings: ⬆️ Buy - DraftKings reversed from support zone - Likely to rise to resistance level…

17 hours ago

NVDA Wave Analysis – 4 December 2025

NVDA: ⬆️ Buy - NVDA reversed from support zone - Likely to rise to resistance level…

18 hours ago

Basic Attention Token Wave Analysis – 4 December 2025

Basic Attention Token: ⬇️ Sell - Basic Attention Token reversed from resistance level 0.2800 - Likely…

18 hours ago

This website uses cookies