Categories: Technical analysis

Alibaba Wave Analysis – 16 September 2025

Alibaba: ⬆️ Buy

– Alibaba broke key resistance level 147.70

– Likely to rise to resistance level 170.00

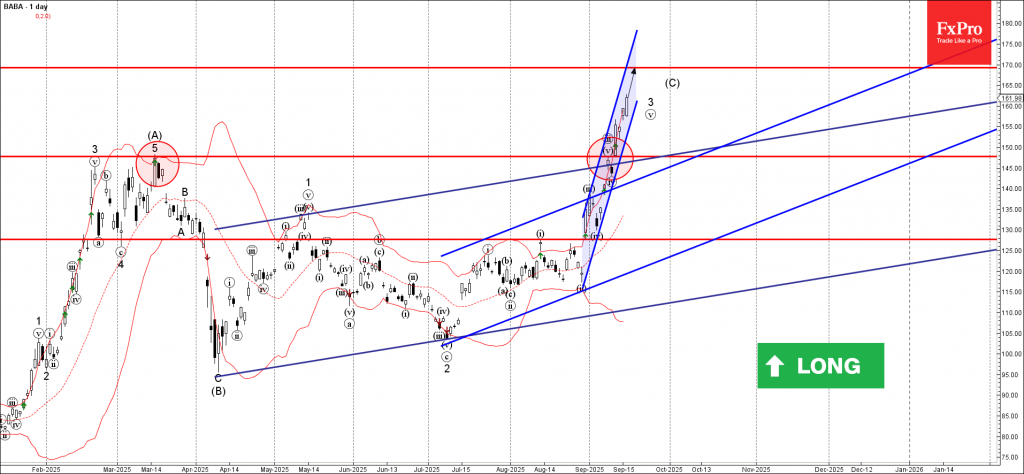
Alibaba Group has been rising sharply in the last few trading sessions after the earlier breakout of the key resistance level 147.70 (which stopped the previous wave (A) in the middle of March, as can be seen below).

The breakout of the resistance level 147.70 was preceded by the breakout of the 2 daily up channels from July and April – which accelerated the active impulse wave (C).

Given the strong daily uptrend, Alibaba Group can be expected to rise to the next round resistance level 170.00, the target for the completion of the active impulse wave (C).

The FxPro Tech Analysis Team

The FxPro technical experts prepare a daily analysis of the most active currency pairs (majors, crosses, exotics) and commodities. Selected instruments are reviewed on daily trends (D1, H4), using the active Elliott Wave setups, Japanese candlesticks, indicators, and support/resistance levels.

Share
Published by
The FxPro Tech Analysis Team
Tags: Alibaba

Recent Posts

AUDUSD Wave Analysis – 24 December 2025

AUDUSD: ⬆️ Buy - AUDUSD broke key resistance level 0.6690 - Likely to rise to…

2 days ago

Tron Wave Analysis – 24 December 2025

Tron: ⬇️ Sell - Tron reversed from resistance zone - Likely to fall to support…

2 days ago

Stellar Wave Analysis – 24 December 2025

Stellar: ⬇️ Sell - Stellar reversed from pivotal resistance level 0.2200 - Likely to fall…

2 days ago

USDCHF Wave Analysis – 24 December 2025

USDCHF: ⬇️ Sell - USDCHF broke support level 0.7885 - Likely to fall to support…

2 days ago

Precious metals rewarded for success

The US dollar is falling as a safe-haven asset amid growing risk appetite. Gold is…

2 days ago

Crypto market: the punchline is coming soon

Market Overview The crypto market cap declined 1.7% over the past day and 15% or…

2 days ago

This website uses cookies