Categories: Technical analysis

Alibaba Wave Analysis 13 June 2024

– Alibaba broke key support level 78.00

– Likely to fall to support level 74.00

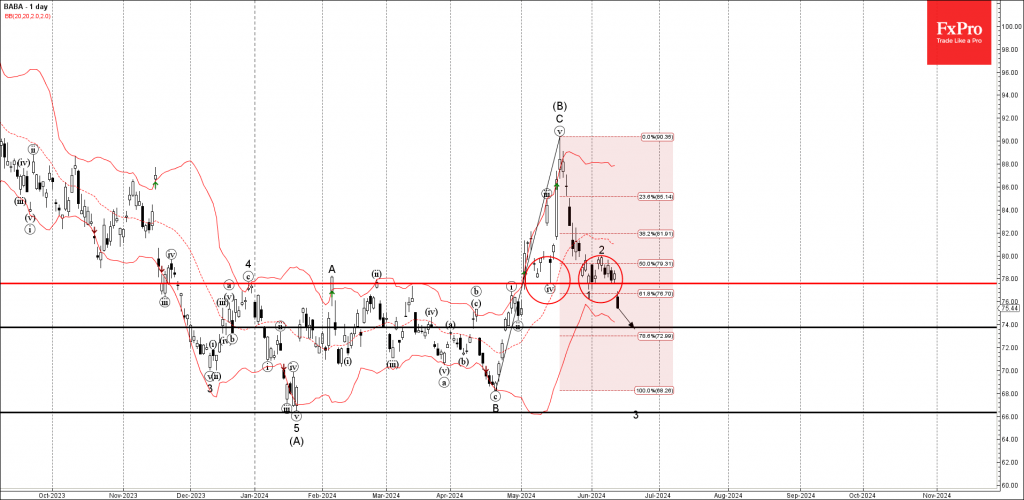
Alibaba Group today opened with the downward gap breaking below the key support level 78.00 (which has been reversing the price from the middle of May).

The breakout of the support level 78.00 coincided with the breakout of the 61.8% Fibonacci correction of the previous upward impulse C from April.

Given the strength of the active impulse waves 3 and (C) and the weekly downtrend, Alibaba Group can be expected to fall further to the next support level 74.00, former support from the end of April.

The FxPro Tech Analysis Team

The FxPro technical experts prepare a daily analysis of the most active currency pairs (majors, crosses, exotics) and commodities. Selected instruments are reviewed on daily trends (D1, H4), using the active Elliott Wave setups, Japanese candlesticks, indicators, and support/resistance levels.

Share
Published by
The FxPro Tech Analysis Team
Tags: Alibaba

Recent Posts

GBPCHF Wave Analysis 25 June 2024

- GBPCHF reversed from support level 1.1220 - Likely to rise to resistance level 1.1450…

9 hours ago

USDCAD Wave Analysis 25 June 2024

- USDCAD reversed from key support level 1.3620 - Likely to rise to resistance level…

9 hours ago

Nasdaq100 and Nvidia: shakeout, but no reversal yet

Shares of Nvidia, the world's most traded, most popular, and most valuable company, have been…

18 hours ago

Bitcoin’s Attractive Drop

Market Picture The cryptocurrency market was falling to a total capitalisation of $2.2 trillion at…

20 hours ago

Amazon Wave Analysis 24 June 2024

- Amazon reversed from key resistance level 188.50 - Likely to fall to support level…

1 day ago

EURJPY Wave Analysis 24 June 2024

- EURJPY approaching strong resistance level 171.55 - Likely to correct down from 171.55 EURJPY…

1 day ago

This website uses cookies