Categories: Technical analysis

Alibaba Wave Analysis – 10 January, 2023

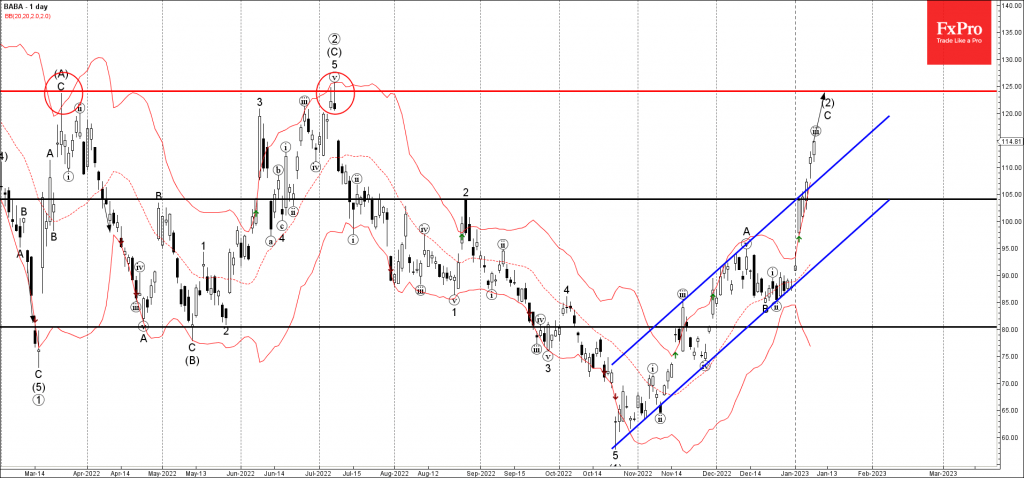
 • Alibaba rising inside impulse wave C

• Likely to reach resistance level 125.00

Alibaba continues to rise inside the active impulse wave C, which previously broke the key resistance level 105.00 (former monthly high from August).

The breakout of the resistance level 105.00 coincided with the breakout of the daily up channel from October – which accelerated the active impulse wave C.

Alibaba can be expected to rise further toward the next resistance level 125.00 (earlier monthly high from Marc and July and the forecast price for the completion of the active impulse wave C).

The FxPro Tech Analysis Team

The FxPro technical experts prepare a daily analysis of the most active currency pairs (majors, crosses, exotics) and commodities. Selected instruments are reviewed on daily trends (D1, H4), using the active Elliott Wave setups, Japanese candlesticks, indicators, and support/resistance levels.

Share
Published by
The FxPro Tech Analysis Team
Tags: Alibaba

Recent Posts

Nat Gas Current situation #tradelikeapro #trading #natgas #tradingstrategy #tradingshorts

Today is Tuesday, the 13th of January, and we will talk about the natural gas…

1 hour ago

Bitcoin Cash Wave Analysis – 12 January 2026

Bitcoin Cash: ⬇️ Sell - Bitcoin Cash reversed from resistance area - Likely to fall…

11 hours ago

EURJPY Wave Analysis – 12 January 2026

EURJPY: ⬆️ Buy - EURJPY reversed from support area - Likely to rise to resistance…

11 hours ago

Gold shines on an anti-fiat thesis

The dollar suffered due to threats to the Fed’s independence. Gold managed to renew its…

21 hours ago

SP500 Current situation #trading #tradelikeapro #sp500 #tradingshorts #tradingstrategy

Today is Monday, the 12th of January, and once again we will talk about the…

21 hours ago

Crypto: sell-the-growth continues

Crypto markets remain volatile; Bitcoin faces selling pressure, XRP slips, Monero surges, and market signals…

22 hours ago

This website uses cookies