Categories: Technical analysis

Alibaba Group Wave Analysis 26 September 2024

– Alibaba Group broke resistance zone

– Likely to rise to resistance level 120.00

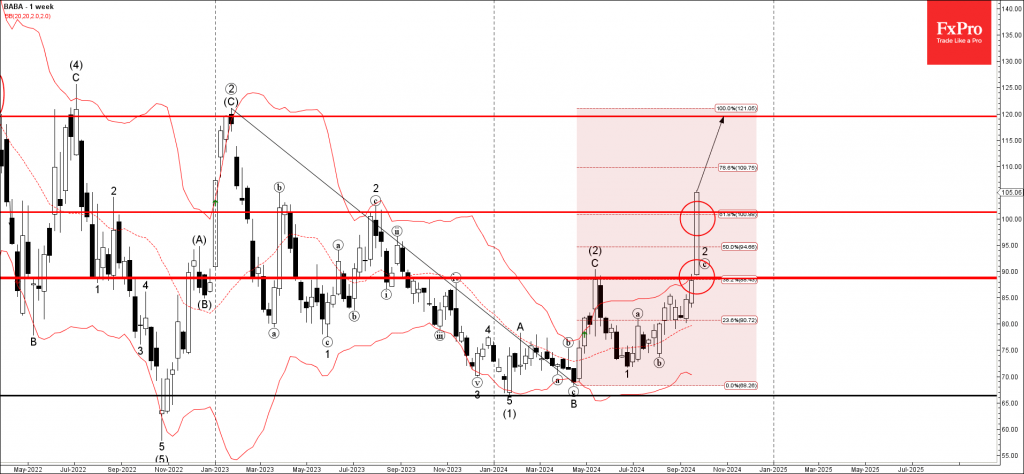
Alibaba Group under the bullish pressure after breaking the resistance zone lying between the key resistance level 101.25 (which also reversed the price in the middle of 2023) and the 61.8% Fibonacci correction of the weekly downtrend from last year.

The breakout of this resistance zone should further accelerate the active wave 2, which earlier broke the round resistance level 90.00.

Given the strength of the active wave 2, Alibaba Group can be expected to rise further to the next resistance level 120.00 (former yearly high from the start of 2023).

The FxPro Tech Analysis Team

The FxPro technical experts prepare a daily analysis of the most active currency pairs (majors, crosses, exotics) and commodities. Selected instruments are reviewed on daily trends (D1, H4), using the active Elliott Wave setups, Japanese candlesticks, indicators, and support/resistance levels.

Share
Published by
The FxPro Tech Analysis Team
Tags: Alibaba

Recent Posts

CHFJPY Wave Analysis – 9 January 2026

CHFJPY: ⬆️ Buy - CHFJPY reversed from support area - Likely to rise to resistance…

1 day ago

Exxon Mobil Wave Analysis – 9 January 2026

Exxon Mobil: ⬆️ Buy - Exxon Mobil reversed from support area - Likely to rise…

1 day ago

Pro News Weekly: Dollar Rebounds as Markets Test New Limits

Welcome to Pro News Weekly! Here’s what is shaping the markets: 💵 The U.S. dollar…

1 day ago

Geopolitics will destroy the euro

•    EURUSD falls due to geopolitics and expectations of tariff removal •    Gold returns to…

2 days ago

Platinum Wave Analysis – 8 January 2026

Platinum: ⬇️ Sell - Platinum reversed from pivotal resistance level 150.00 - Likely to fall to…

2 days ago

Baidu Wave Analysis – 8 January 2026

Baidu: ⬇️ Sell - Baidu reversed from resistance zone - Likely to fall to support level…

2 days ago

This website uses cookies