Categories: Technical analysis

Alibaba Group Wave Analysis – 2 September 2025

Alibaba Group: ⬆️ Buy

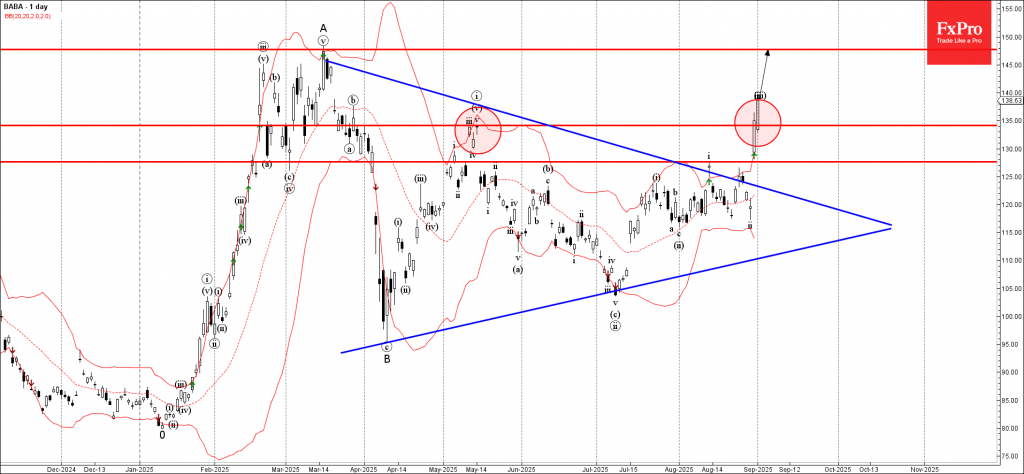
– Alibaba Group broke resistance level 135.00

– Likely to rise to resistance level 147.70

Alibaba Group recently broke the resistance level 135.00 (former monthly high from May), which was preceded by the breakout of the resistance level 127.60 (top of wave i from August).

Before breaking these resistance levels Alibaba Group broke the extended daily Triangle from March.

Alibaba Group can be expected to rise to the next resistance level 147.70, the former multi-month high from March.

The FxPro Tech Analysis Team

The FxPro technical experts prepare a daily analysis of the most active currency pairs (majors, crosses, exotics) and commodities. Selected instruments are reviewed on daily trends (D1, H4), using the active Elliott Wave setups, Japanese candlesticks, indicators, and support/resistance levels.

Share
Published by
The FxPro Tech Analysis Team
Tags: Alibaba

Recent Posts

Platinum Wave Analysis – 8 January 2026

Platinum: ⬇️ Sell - Platinum reversed from pivotal resistance level 150.00 - Likely to fall to…

9 hours ago

Baidu Wave Analysis – 8 January 2026

Baidu: ⬇️ Sell - Baidu reversed from resistance zone - Likely to fall to support level…

9 hours ago

EURUSD Wave Analysis – 8 January 2026

EURUSD: ⬇️ Sell - EURUSD broke daily up channel - Likely to fall to support…

10 hours ago

WTI crude oil Wave Analysis – 8 January 2026

WTI crude oil: ⬆️ Buy - WTI crude oil reversed from support zone - Likely…

10 hours ago

Do not underestimate dollar

Positive macro statistics for the US are helping the greenback. Gold could rise to $4,610…

17 hours ago

Crypto fails to find support for a breakout

Crypto markets fell amid caution; Bitcoin and Ethereum face technical and investor shifts, with privacy…

18 hours ago

This website uses cookies