Categories: Technical analysis

Alcoa Wave Analysis 8 August 2023

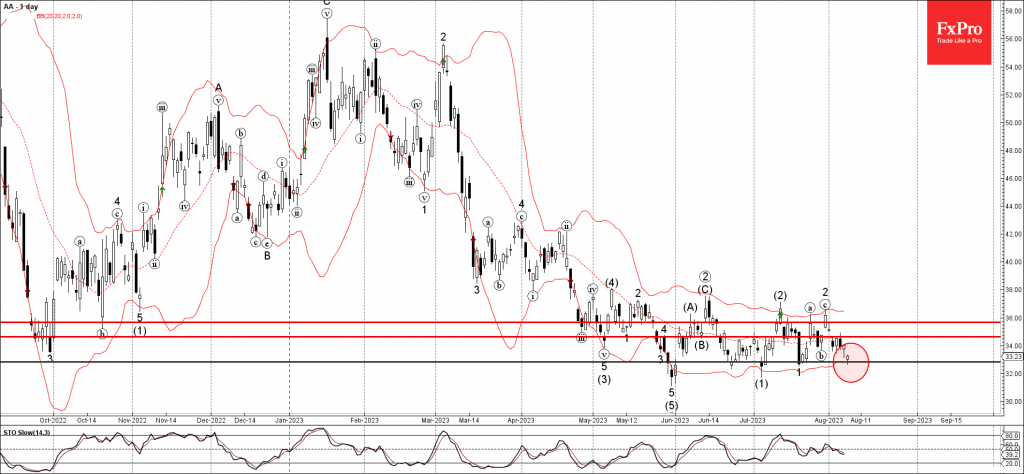
– Alcoa reversed from key support level 32.80

– Likely to rise to resistance level 34.65

Alcoa recently reversed up from the key support level 32.80, which has been reversing the price from May, coinciding with the lower daily Bollinger Band.

The upward reversal from the support level 32.80 is likely to form the daily Japanese candlesticks reversal pattern Hammer – strong buy signal for Alcoa.

Given the strength of the support level 32.80, Alcoa can be expected to fall further toward the next resistance level 34.65.

The FxPro Tech Analysis Team

The FxPro technical experts prepare a daily analysis of the most active currency pairs (majors, crosses, exotics) and commodities. Selected instruments are reviewed on daily trends (D1, H4), using the active Elliott Wave setups, Japanese candlesticks, indicators, and support/resistance levels.

Share
Published by
The FxPro Tech Analysis Team
Tags: Alcoa

Recent Posts

Pro News Flash: Bitcoin Is Stuck While Billion Dollar Buyers Step In

🛟 Bitcoin is having a hard time staying afloat, even as major players step in…

3 hours ago

Natural Gas. Current situation #trandingshorts #tradelikeapro #trading #tradingstrategy #naturalgas

We're gonna talk about the gas market, where prices are falling rapidly. Let's take a…

5 hours ago

The dollar remains focused on the labour market

The US dollar weakened significantly in 2025, and its fate depends on central banks. The…

5 hours ago

Major coins dragged the market down

Major cryptocurrencies fell amid declining market sentiment, low liquidity, and institutional rebalancing, with Bitcoin dropping…

7 hours ago

Dogecoin Wave Analysis – 15 December 2025

Dogecoin: ⬇️ Sell - Dogecoin broke long-term support level 0.1365 - Likely to fall to…

20 hours ago

Alcoa Wave Analysis – 15 December 2025

Alcoa: ⬇️ Sell - Alcoa reversed from strong resistance level 47.00 - Likely to fall to…

20 hours ago

This website uses cookies