Categories: Technical analysis

Alcoa Wave Analysis – 21 January, 2020

  • Alcoa broke strong support area
  • Likely to fall to 16.50

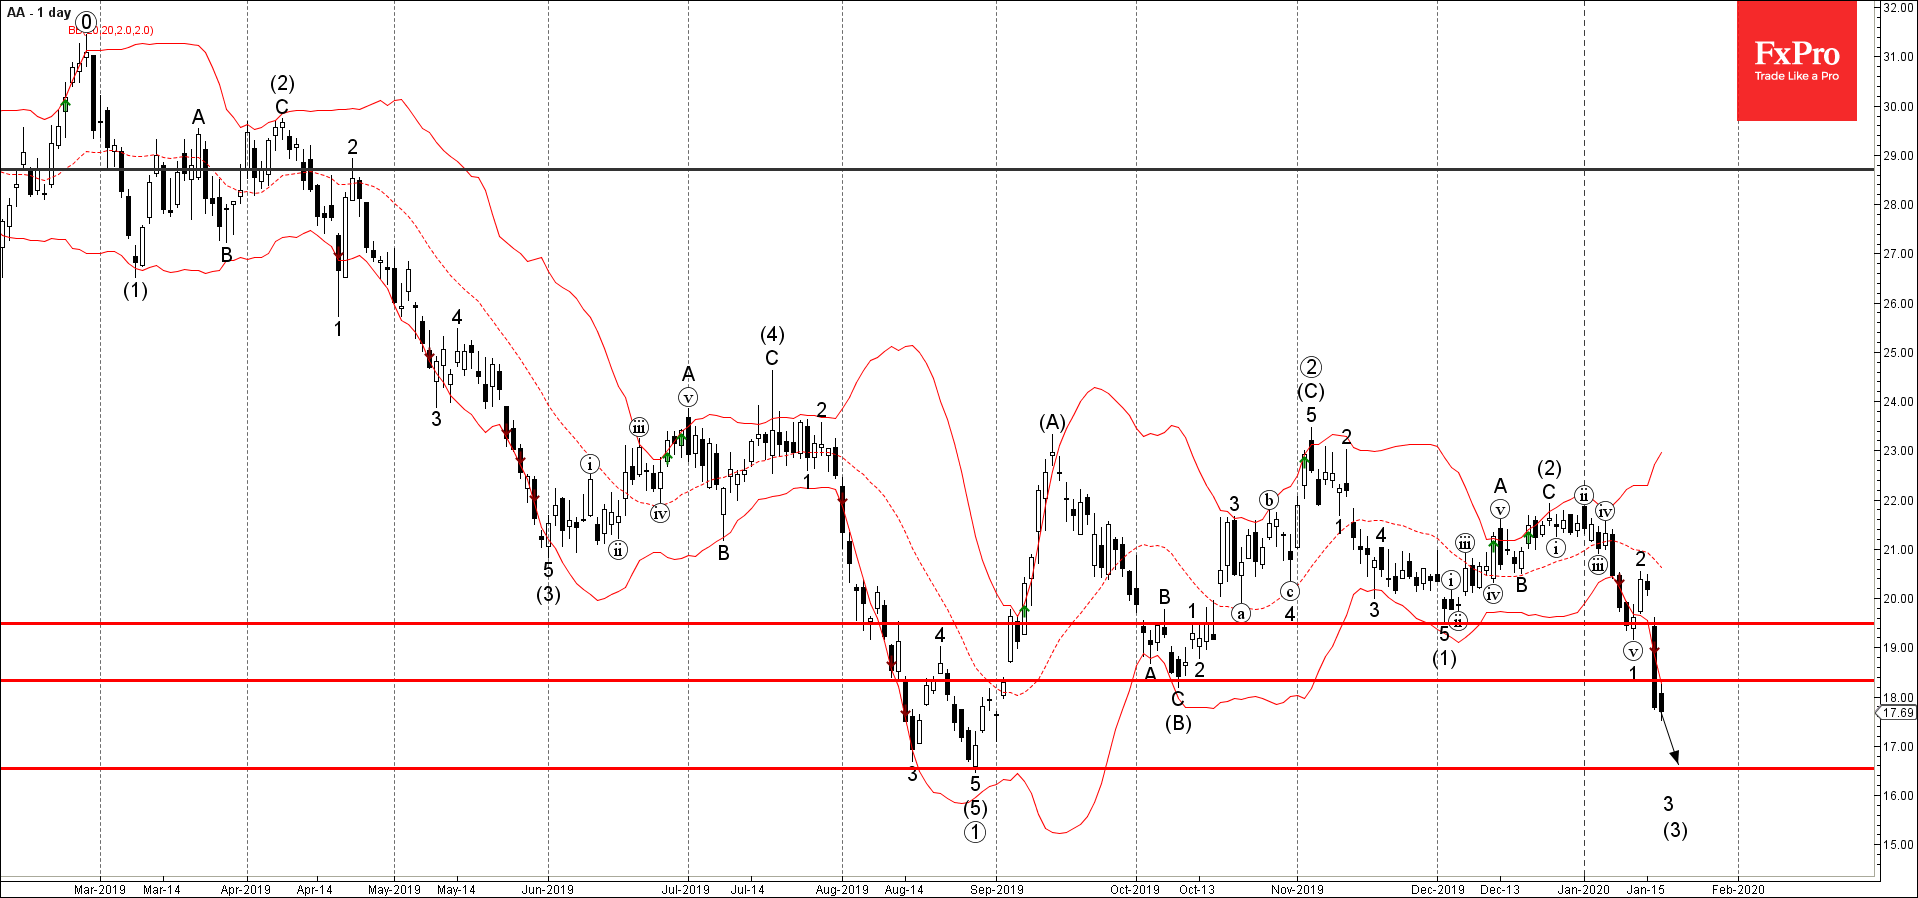
Alcoa recently broke sharply through the strong support area lying between the key support levels 19.50 (low of wave (1) from December) and 18.3 (monthly low from October).

The breakout of this support area accelerated the active impulse wave 3 – which belongs to the medium-term impulse sequence (3) from December.

Alcoa is likely to fall further toward the next support level 16.50 (which stopped the sharp downtrend in August of 2019).

The FxPro Tech Analysis Team

The FxPro technical experts prepare a daily analysis of the most active currency pairs (majors, crosses, exotics) and commodities. Selected instruments are reviewed on daily trends (D1, H4), using the active Elliott Wave setups, Japanese candlesticks, indicators, and support/resistance levels.

Share
Published by
The FxPro Tech Analysis Team
Tags: AA

Recent Posts

ANF Wave Analysis 29 April 2024

ANF reversed from key support level 113.40 Likely to rise to resistance level 132.31 ANF…

2 hours ago

GBPUSD Wave Analysis 29 April 2024

- GBPUSD rising inside minor correction 2 - Likely to rise to resistance level 1.2700…

2 hours ago

Crypto Market Retreats Due to Overhang of Sellers

Market picture The crypto market has lost 3.3% in the last 24 hours to $2.3…

12 hours ago

USDJPY Wave Analysis 26 April 2024

- USDJPY broke key resistance level 155.00 - Likely to rise to resistance level 160.00…

3 days ago

Ebay Wave Analysis 26 April 2024

- Ebay reversed from support level 49.35 - Likely to rise to resistance level 52.55…

3 days ago

False Alert with Yen Interventions?

Even though the Bank of Japan left the key rate and parameters of the QE…

3 days ago

This website uses cookies