Categories: Technical analysis

AIG Wave Analysis 22 January, 2021

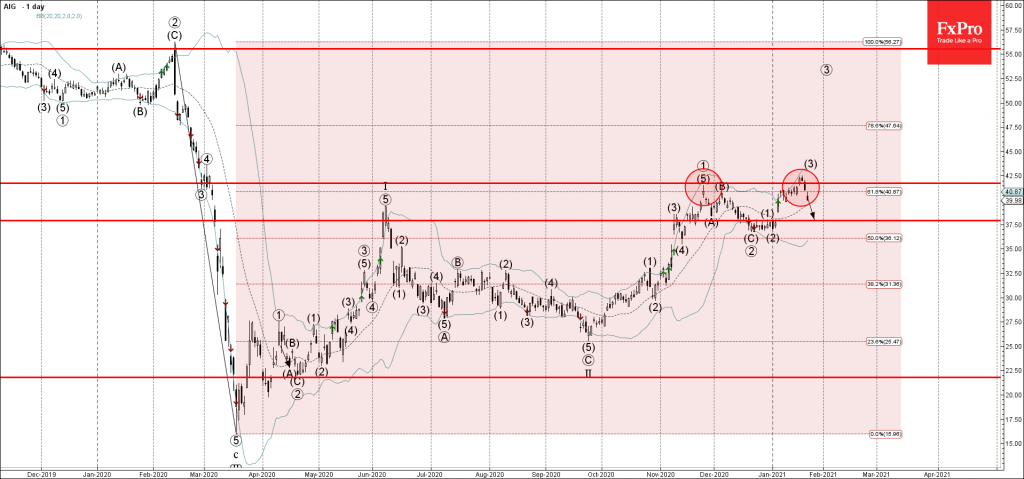
• AIG reversed from resistance level 41.75

• Likely to reach support level 37.50

AIG continues to fall after the price failed to hold the ground above the major resistance level 41.75 (former monthly high from November) standing near the upper daily Bollinger Band.

The downward reversal from the resistance level 41.75 stopped the previous medium-term upward impulse wave (3).

AIG is expected to fall further the next support level 37.50 (former upper boundary of the tight narrow congestion zone at the end of December).

The FxPro Tech Analysis Team

The FxPro technical experts prepare a daily analysis of the most active currency pairs (majors, crosses, exotics) and commodities. Selected instruments are reviewed on daily trends (D1, H4), using the active Elliott Wave setups, Japanese candlesticks, indicators, and support/resistance levels.

Share
Published by
The FxPro Tech Analysis Team
Tags: AIG

Recent Posts

Bitcoin’s Downtrend, Solana and Ethereum Form Double Bottom

Market picture  Crypto market capitalisation rose 3.3% in 24 hours to $2.22 trillion. Local capitalisation…

1 hour ago

EURJPY Wave Analysis 2 May 2024

- EURJPY under strong bearish pressure - Likely to fall to support level 163.10 EURJPY…

15 hours ago

WTI crude oil Wave Analysis 2 May 2024

- WTI broke round support level 80.00 - Likely to fall to support level 76.00…

15 hours ago

ADP hints at another strong NFP on Friday

The monthly ADP labour market report showed that America created 192K new jobs in April, above…

2 days ago

Fed’s hawkish tone risks sinking S&P500 to 4700

Bears showed strength ahead of the FOMC decision.  U.S. indices sagged on Tuesday as investors…

2 days ago

A new stage of Bitcoin’s decline

Market Picture  Bitcoin's closing price on Tuesday became the lowest since late February, confirming the…

2 days ago

This website uses cookies