Categories: Technical analysis

AIG Wave Analysis 21 March 2024

– AIG broke key resistance level 75.00

– Likely to rise to resistance level 80.00

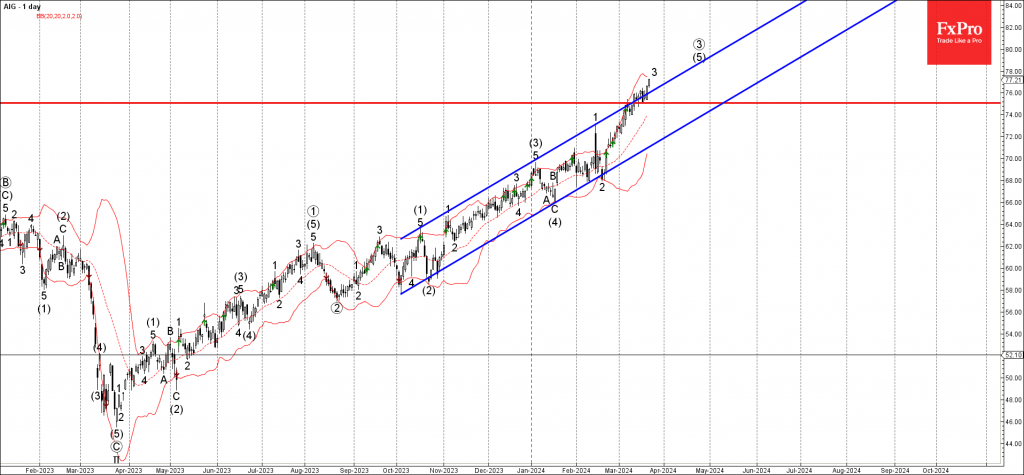
AIG recently broke the key resistance level 75.00, intersecting with the resistance trendline of the daily up channel from October.

The breakout of the resistance level 75.00 accelerated the active short-term impulse wave 3 of the intermediate impulse wave (5) from January.

Given the clear daily uptrend, AIG can be expected to rise further to the next resistance level 80.00.

The FxPro Tech Analysis Team

The FxPro technical experts prepare a daily analysis of the most active currency pairs (majors, crosses, exotics) and commodities. Selected instruments are reviewed on daily trends (D1, H4), using the active Elliott Wave setups, Japanese candlesticks, indicators, and support/resistance levels.

Share
Published by
The FxPro Tech Analysis Team
Tags: AIG

Recent Posts

USDJPY. Current situation #tradelikeapro #tradingstrategy #trandingshorts #usdjpy #usdjpytoday

Today is Monday, December 15th, and we're going to talk about the Japanese yen, where…

1 hour ago

ECB, BoE, and BoJ take different paths

Trump pushes for more Fed rate cuts, while no changes are expected from the ECB…

4 hours ago

Crypto Market Holds at $3T Amid Broken Uptrend

Crypto market stays near $3T amid correction, ETF inflows rise, sentiment weakens, and volatility expected…

5 hours ago

Gold Wave Analysis – 12 December 2025

Gold: ⬇️ Sell - Gold reversed from strong resistance level 4350.00 - Likely to fall to…

3 days ago

EURGBP Wave Analysis – 12 December 2025

EURGBP: ⬆️ Buy - EURGBP reversed from support zone - Likely to rise to resistance level…

3 days ago

Filecoin Wave Analysis – 12 December 2025

Filecoin: ⬇️ Sell - Filecoin broke key support level 1.435 - Likely to fall to support…

3 days ago

This website uses cookies