Categories: Technical analysis

Aig Wave Analysis 17 October 2024

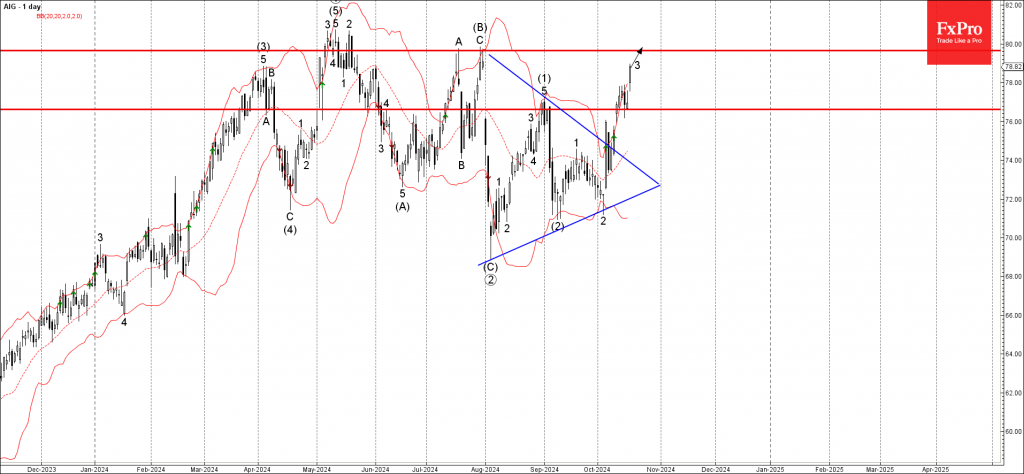
– Aig reversed from support level 76.60

– Likely to rise to resistance level 79.65

Aig recently reversed up from the pivotal support level 76.60 (former strong resistance level which stopped the previous impulse wave (1)) at the end of August.

The price earlier broke the daily Triangle from July – which accelerated the active impulse wave 3 of the higher impulse wave (3) from September.

Given the clear daily uptrend, Aig can be expected to rise further to the next resistance level 79.65 (former double top from July and the target for the completion of the active impulse wave 3).

The FxPro Tech Analysis Team

The FxPro technical experts prepare a daily analysis of the most active currency pairs (majors, crosses, exotics) and commodities. Selected instruments are reviewed on daily trends (D1, H4), using the active Elliott Wave setups, Japanese candlesticks, indicators, and support/resistance levels.

Share
Published by
The FxPro Tech Analysis Team
Tags: AIG

Recent Posts

Apple Wave Analysis 17 October 2024

- Apple reversed from key resistance level 237.00 - Likely to fall to support level 227.00…

9 hours ago

The Crypto Market Stabilises at the Top

Market Picture The cryptocurrency market remains steady at around $2.31 trillion in market capitalisation, mirroring…

18 hours ago

GBPCAD Wave Analysis 16 October 2024

- GBPCAD reversed from resistance zone - Likely to fall to support level 1.7750 GBPCAD…

1 day ago

USDCHF Wave Analysis 16 October 2024

- USDCHF broke resistance zone - Likely to rise to resistance level 0.8730 USDCHF currency…

1 day ago

Pound Suppressed by Weak Inflation

The British pound fell below the 1.30 level against the dollar after weak inflation data…

2 days ago

The Crypto Market Is Trying to Form an Uptrend

The crypto market is attempting to form an upward trend, with the market capitalization growing…

2 days ago

This website uses cookies