Categories: Technical analysis

Adobe Wave Analysis 7 October 2024

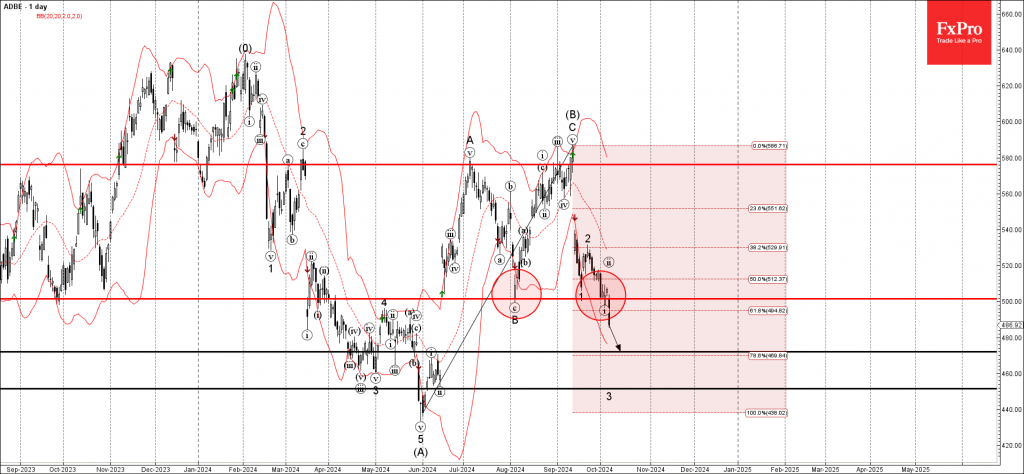
– Adobe broke round support level 500.00

– Likely to fall to support level 470.00

Adobe recently broke the support zone located between the round support level 500.00 (monthly low from August) intersecting with the 61.8% Fibonacci correction of the upward impulse from May.

The breakout pf the support level 500.00 accelerated the active short-term impulse wave 3 – which belongs to wave (C) from the start of September.

August can be expected to fall further to the next support level 470.00, low of the upward gap from the start of June.

The FxPro Tech Analysis Team

The FxPro technical experts prepare a daily analysis of the most active currency pairs (majors, crosses, exotics) and commodities. Selected instruments are reviewed on daily trends (D1, H4), using the active Elliott Wave setups, Japanese candlesticks, indicators, and support/resistance levels.

Share
Published by
The FxPro Tech Analysis Team
Tags: Adobe

Recent Posts

IBM Wave Analysis 8 October 2024

IBM broke resistance zone Likely to rise to resistance level 240.00 IBM continues to rise…

1 hour ago

Nasdaq-100 Wave Analysis 8 October 2024

- Nasdaq-100 reversed from support zone - Likely to rise to resistance level 20340.00 Nasdaq-100…

1 hour ago

Rising Treasury yields attract dollar interest

The Dollar Index has been rising since the end of September, tracking US long-term bond…

7 hours ago

Germany’s manufacturing rebound doesn’t change the gloomy picture

Germany's industrial production index jumped 2.9% in August, almost recovering from a similar drop in…

10 hours ago

Equity Weakness Dampens Crypto Investment Appetite

The crypto market rolled back 1.8% in 24 hours to $2.17 trillion due to a…

13 hours ago

WTI Wave Analysis 7 October 2024

- WTI under strong bullish pressure - Likely to rise to resistance level 78.3 WTI…

1 day ago

This website uses cookies