Categories: Technical analysis

Adobe Wave Analysis 30 October, 2020

• Adobe broke support zone

• Likely to fall to 431.70

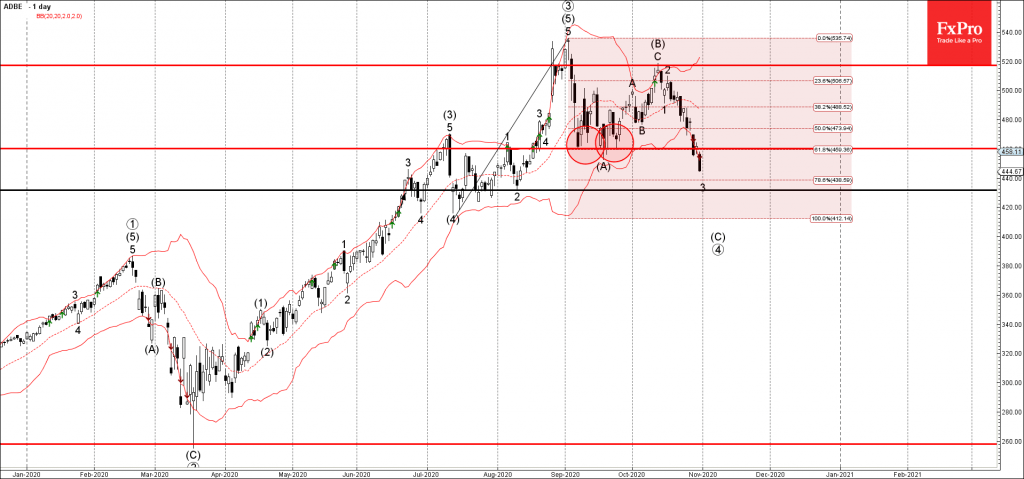
Adobe falling sharply after the earlier breakout of the support zone lying at the intersection of the support level 460.00 (which reversed the price multiple times in September) and the 61.8% Fibonacci correction of the upward impulse from July.

The breakout of this support zone should accelerate the active downward impulse waves 3 and (5).

Adobe is likely to fall further toward the next support level 431.70 (monthly low from August and the target for the completion of the active impulse wave 3).

AddThis Website Tools
The FxPro Tech Analysis Team

The FxPro technical experts prepare a daily analysis of the most active currency pairs (majors, crosses, exotics) and commodities. Selected instruments are reviewed on daily trends (D1, H4), using the active Elliott Wave setups, Japanese candlesticks, indicators, and support/resistance levels.

Share
Published by
The FxPro Tech Analysis Team
Tags: ADBE

Recent Posts

GBPUSD Wave Analysis – 18 March 2025

GBPUSD: ⬆️ Buy - GBPUSD reversed from support zone - Likely to rise to resistance…

1 hour ago

GBPAUD Wave Analysis – 18 March 2025

GBPAUD: ⬆️ Buy - GBPAUD reversed from the support zone - Likely to rise to…

1 hour ago

Solana Wave Analysis – 18 March 2025

Solana: ⬇️ Sell - Solana reversed from the resistance zone - Likely to fall to…

3 hours ago

CHFJPY Wave Analysis – 18 March 2025

CHFJPY: ⬆️ Buy - CHFJPY broke resistance zone - Likely to rise to resistance level…

3 hours ago

The crypto market is stuck in the mud

Market Picture The crypto market has been hovering in a narrow range for the past…

8 hours ago

FTSE 100 Wave Analysis – 17 March 2025

FTSE 100: ⬆️ Buy - FTSE 100 reversed from key support level 8425.00 - Likely…

1 day ago