Categories: Technical analysis

Adobe Wave Analysis – 25 October, 2019

  • Adobe reversed from support zone
  • Likely to rise to 274.00

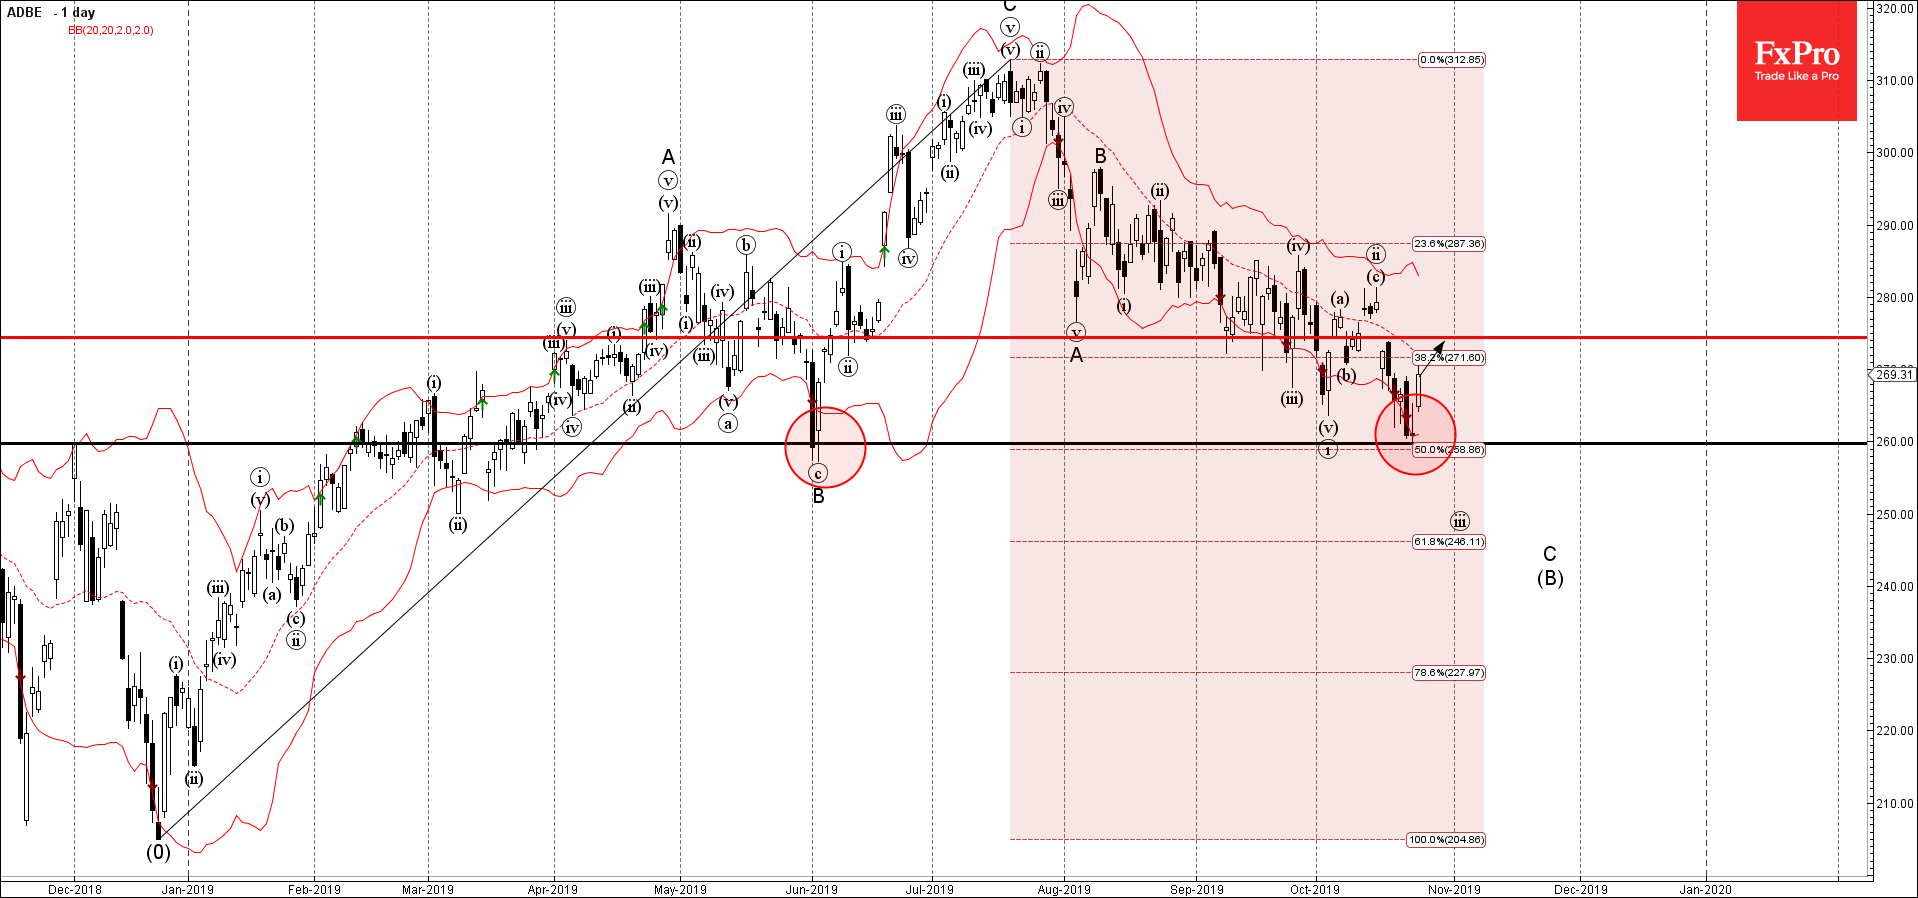
Adobe recently reversed up from support zone lying between the key support level 260.00 (multi-month low from June), lower daily Bollinger Band and the 50% Fibonacci correction of the upward impulse from last December.

The upward reversal from this support area created the daily Morning Star – which stopped the earlier waves C and (B).

Adobe is expected to rise further and retest the next resistance level 274.00 (former strong support from August and September).

The FxPro Tech Analysis Team

The FxPro technical experts prepare a daily analysis of the most active currency pairs (majors, crosses, exotics) and commodities. Selected instruments are reviewed on daily trends (D1, H4), using the active Elliott Wave setups, Japanese candlesticks, indicators, and support/resistance levels.

Share
Published by
The FxPro Tech Analysis Team
Tags: ADBE

Recent Posts

Dow Jones Wave Analysis – 17 December 2025

Dow Jones: ⬇️ Sell - Dow Jones reversed from resistance level 49000.00 - Likely to fall…

6 hours ago

Comcast Wave Analysis – 17 December 2025

Comcast: ⬆️ Buy - Comcast broke resistance area - Likely to rise to resistance level 31.00…

6 hours ago

Platinum Wave Analysis – 17 December 2025

Platinum: ⬆️ Buy - Platinum broke resistance level 1800.00 - Likely to rise to resistance…

7 hours ago

Silver Wave Analysis – 17 December 2025

Silver: ⬆️ Buy - Silver broke resistance zone - Likely to rise to resistance level…

7 hours ago

The labour market did not scare the Fed

The Fed is in no hurry to cut rates, and Hassett is unlikely to accelerate…

11 hours ago

The crypto rebound fades with a 40% drop possible

Crypto market faces renewed downward pressure; Bitcoin may drop further, with diverging forecasts for 2026…

13 hours ago

This website uses cookies