Categories: Technical analysis

Abercrombie & Fitch Wave Analysis 7 December, 2020

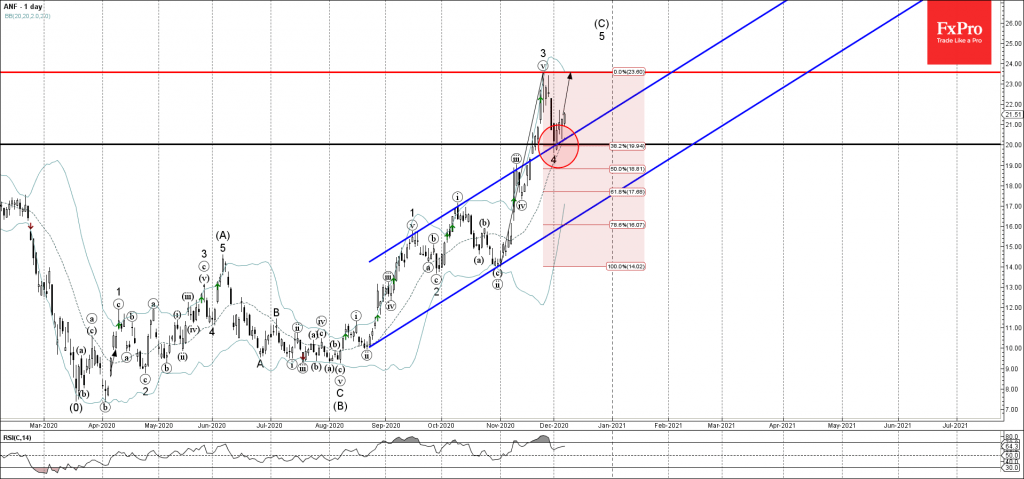
• Abercrombie & Fitch reversed from support level 20.00

• Likely to rise to 23.55

Abercrombie & Fitch recently reversed up from the support area lying between the round support level 20.00, 50% Fibonacci correction of the upward impulse from October and the upper trendline of the daily up channel from August.

The upward reversal from this support area started the active short-term impulse wave 5 – which belongs to wave (C) from August.

Abercrombie & Fitch is expected to rise further toward the next resistance level 23.55 (top of the previous minor impulse wave 3).

The FxPro Tech Analysis Team

The FxPro technical experts prepare a daily analysis of the most active currency pairs (majors, crosses, exotics) and commodities. Selected instruments are reviewed on daily trends (D1, H4), using the active Elliott Wave setups, Japanese candlesticks, indicators, and support/resistance levels.

Share
Published by
The FxPro Tech Analysis Team
Tags: ANF

Recent Posts

Pro News Weekly: Market Shake-Up, Dollar Drops, Gold Surges, Bitcoin Wobbles!

Welcome to Pro News Flash! 💵 The U.S. dollar slips 🏆 Major stock indices struggle…

5 hours ago

Solana Wave Analysis – 5 December 2025

Solana: ⬇️ Sell - Solana reversed from resistance zone - Likely to fall to support…

6 hours ago

EURAUD Wave Analysis – 5 December 2025

EURAUD : ⬇️ Sell - EURAUD broke the support level 1.7600 - Likely to fall…

6 hours ago

Forex has set its priorities

In 2026, experts favour the yen, see modest euro growth, and expect pressure on the…

10 hours ago

Bear market rebound in crypto is likely to continue

Crypto rebounds continue; Bitcoin faces resistance, with a mixed market outlook ahead, as regulatory changes…

11 hours ago

Coca-Cola Wave Analysis – 4 December 2025

Coca-Cola: ⬇️ Sell - Coca-Cola reversed from long-term resistance level 73.25 - Likely to fall to…

1 day ago

This website uses cookies