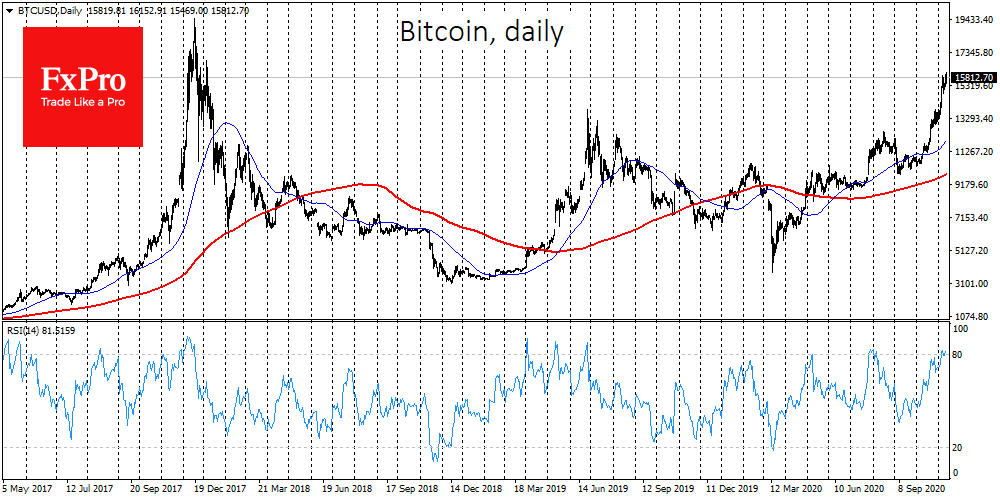
Bitcoin again has managed to overcome $16,000. The demand growth became noticeable on Wednesday after consolidation with a slight downward impulse since the end of last week. The resistance level at $16K so far has been a serious enough barrier for the coin. The intraday dynamics clears a path for an optimistic short term outlook, with the lower time frame charts clearly showing purchases against the background of declines.

The price chart does not show any significant resistance levels up to $20,000, an important round level where Bitcoin was approaching back in late 2017. In the short term, it is worth paying attention to the possible weakening of the growth impulse. On the daily charts, the RSI above 80 is a signal level of overbought conditions. High values for the indicator is not a problem for a bullish impulse, but the return of the index to the area below 80 can trigger powerful profit-taking, as has already been demonstrated three times so far this year.
The current price levels are peaks of almost three years, but fear of being an early seller in the middle of the rally is holding back sales. The pressure on the coin can be utilised by Chinese miners, who have completed the process of moving and kept their equipment off for quite some time, which previously corrected the difficulty of mining.
Judging by the consistent growth in market capitalization of the stablecoin Tether (USDT), which is often used as a source of Bitcoin purchases, increased demand from buyers has so far offset the downward pressure on the first cryptocurrency. Over the last month, USDT capitalization increased by almost $2 bln.
A source of concern for Bitcoin may be the Crypto Fear & Greed Index, which rose 15 points to “87” from last week, corresponding to the “extreme greed” mode. The indicator was around the current values at the end of June 2019, when Bitcoin reached the maximum of the rally, and then started its decline.
While waiting for $20K, it is worth paying attention to lower highs, which may well trigger profit-taking and push Bitcoin down significantly before launching the final stage of the bullish rally in 2020.
The FxPro Analyst Team