Market Overview
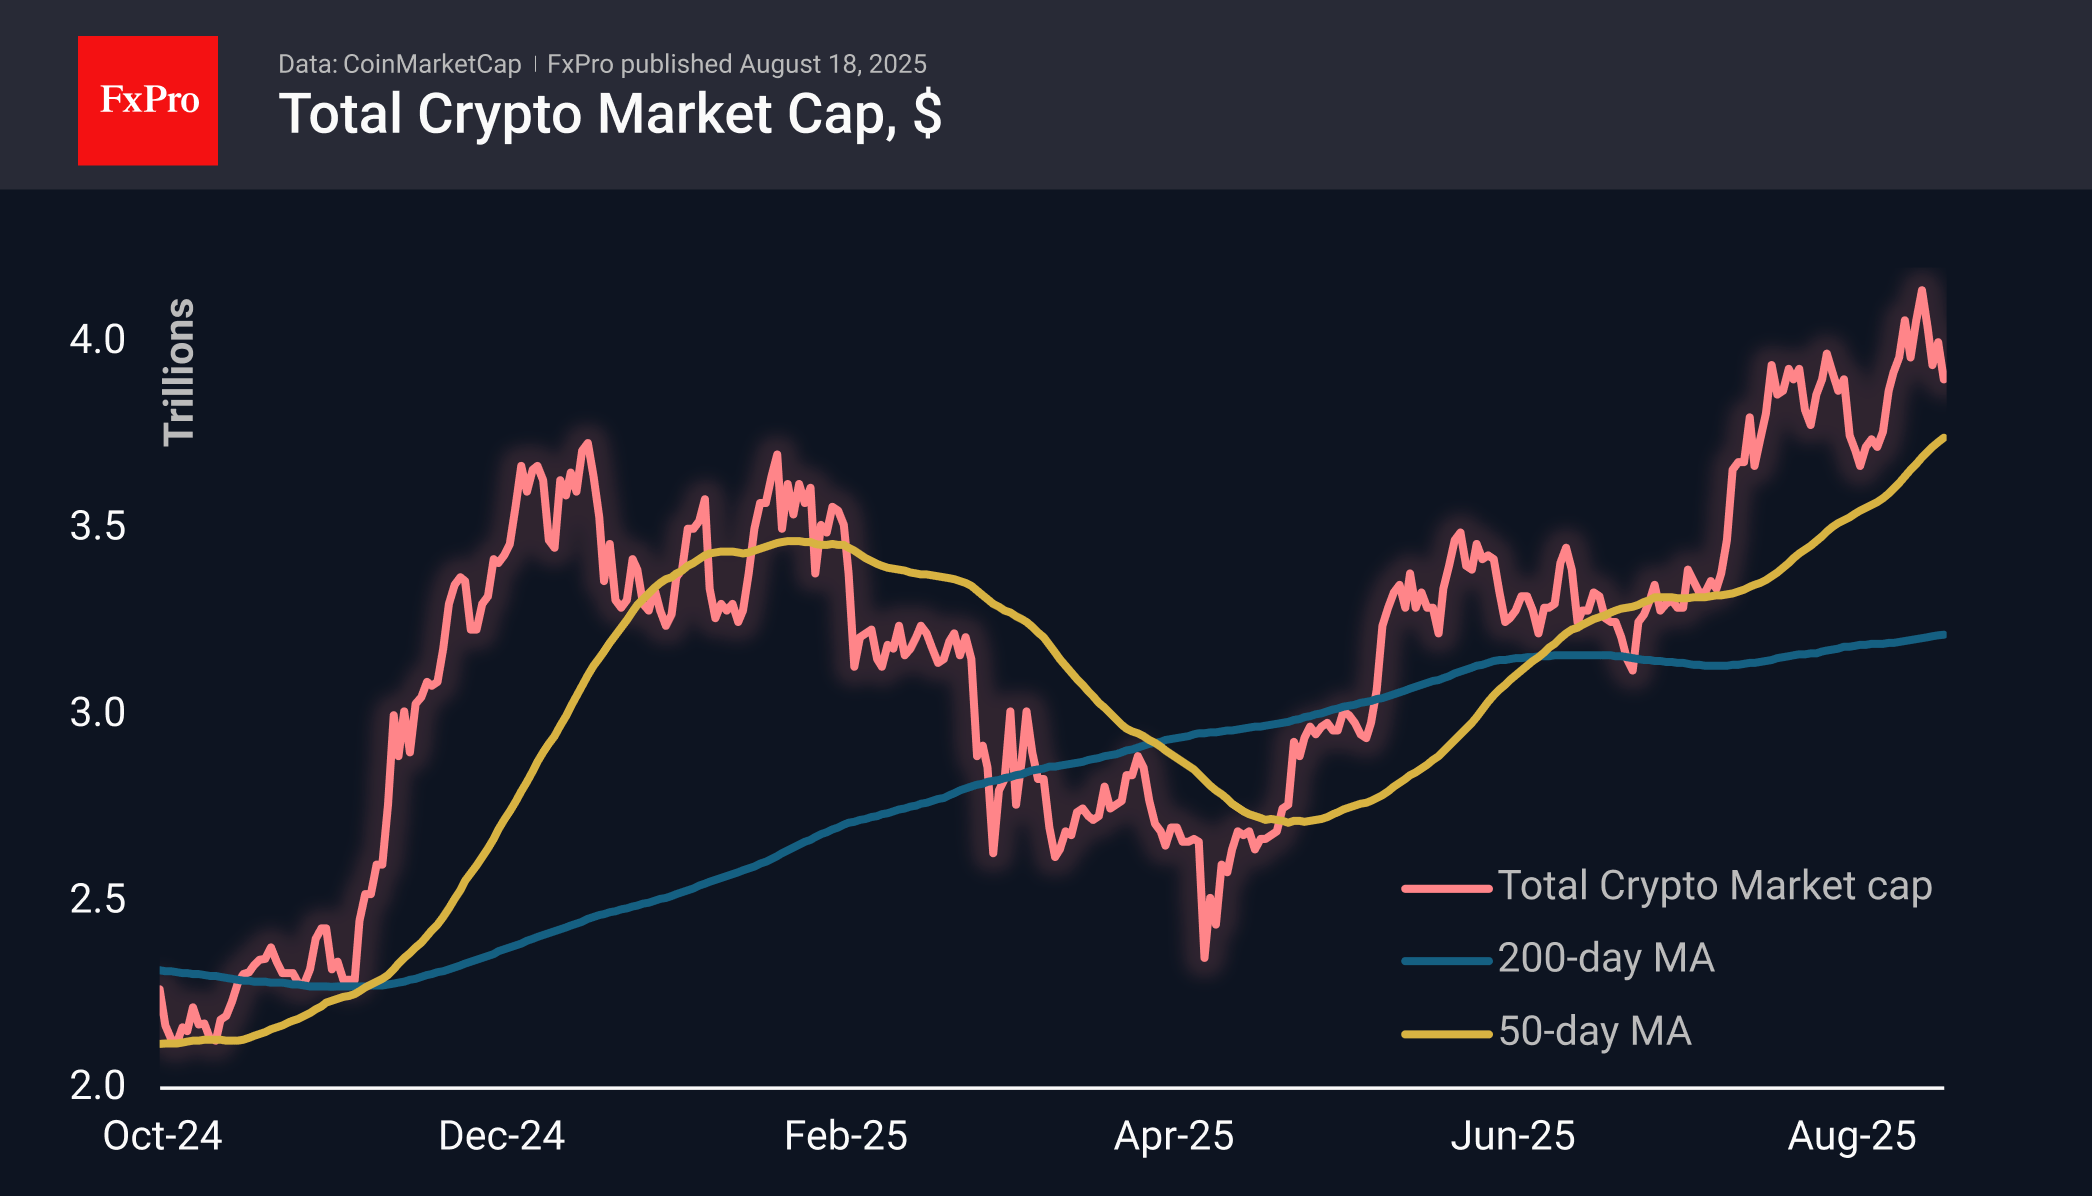
The crypto market continued its decline on Monday after a pause over the weekend. The total capitalisation fell back to $3.88 trillion, reaching its lowest level in more than two weeks. As expected, altcoins are falling the hardest, with Ethereum and XRP losing about 5% in the last 24 hours, twice as much as Bitcoin. The crypto market has returned to the area that acted as resistance in July. Will it become support this time?

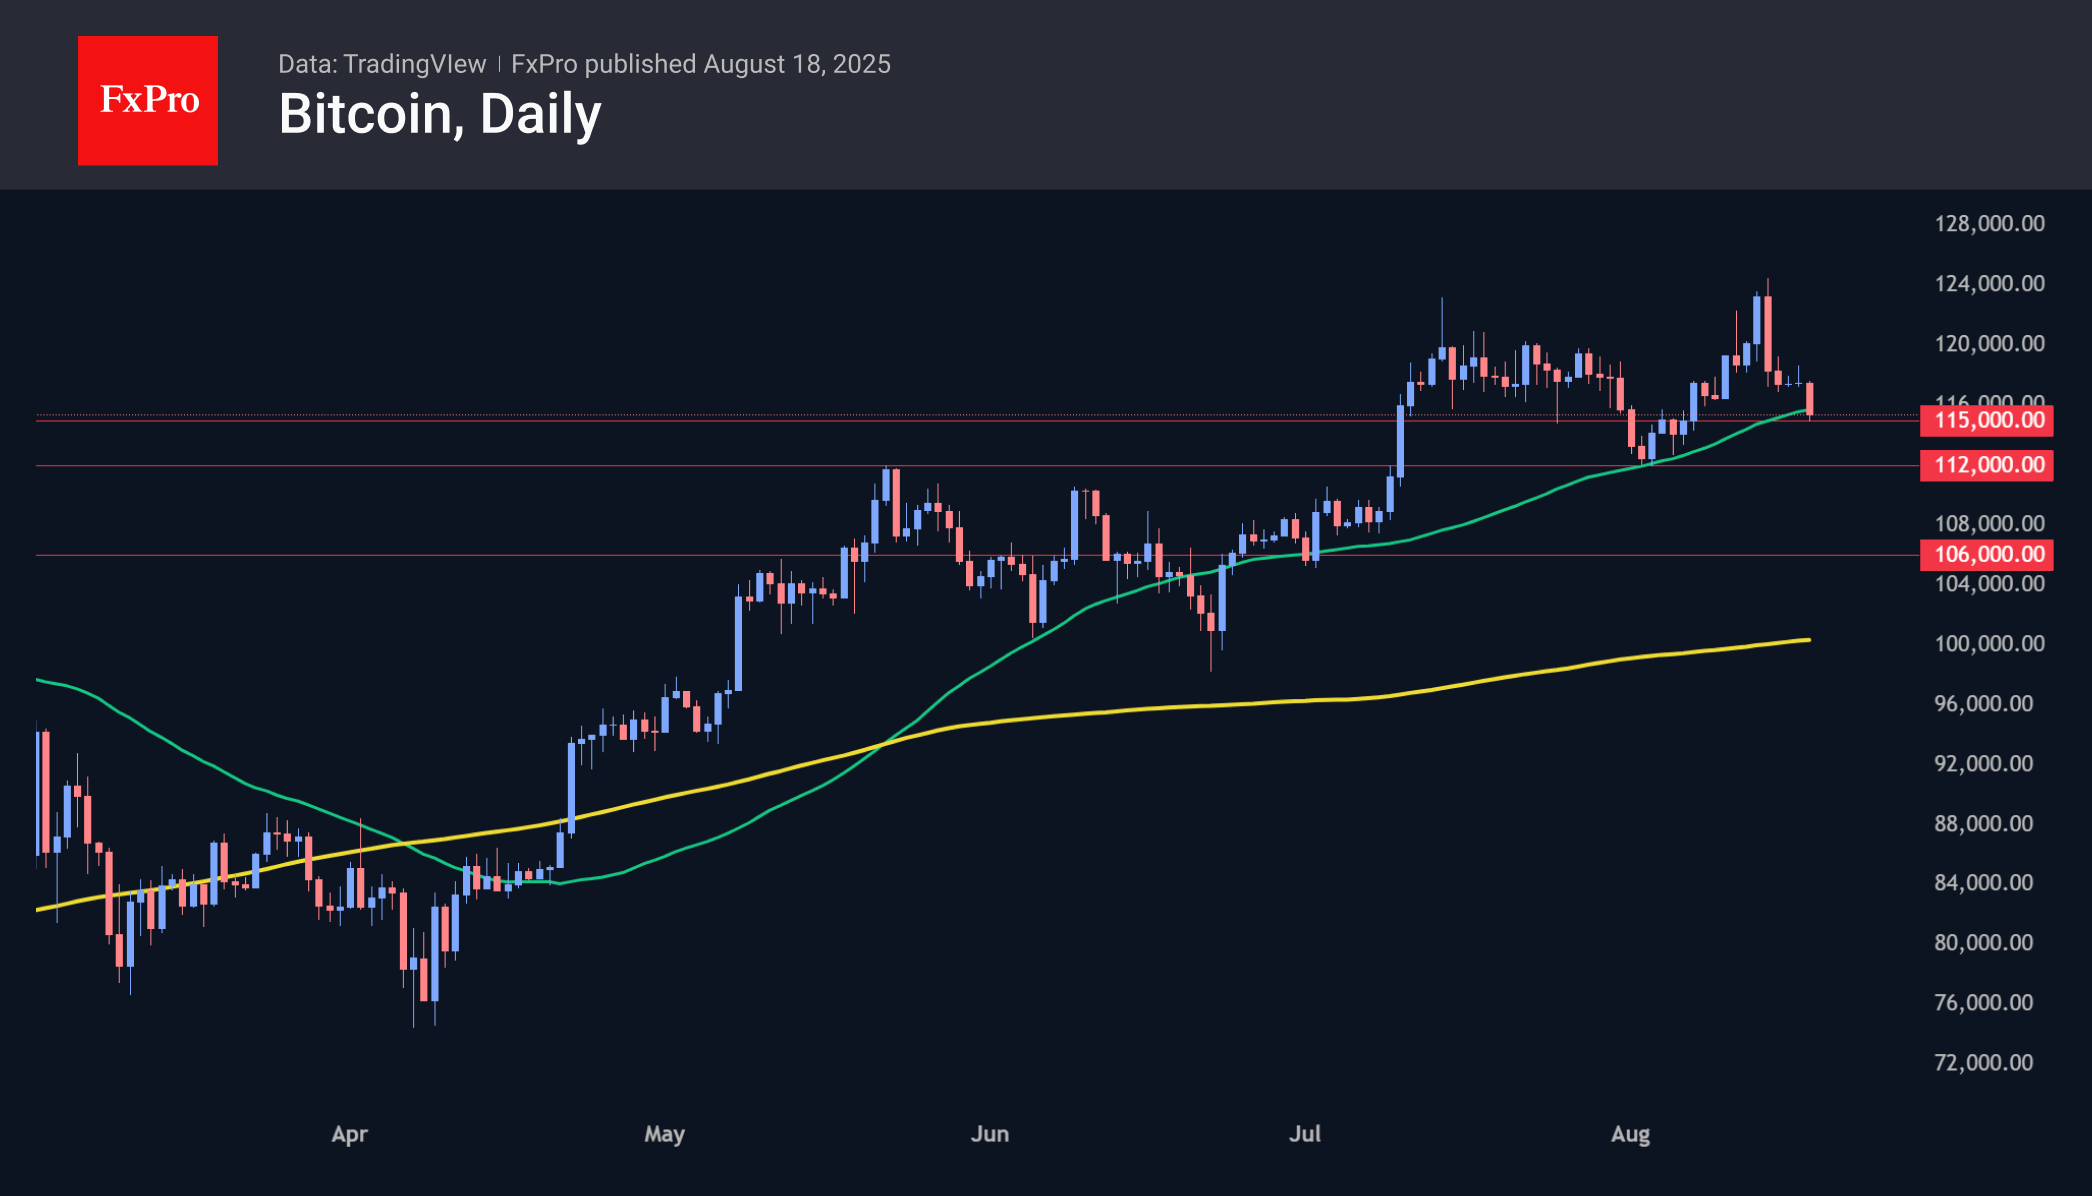
Bitcoin fell to $115K, the lowest level in the last 11 days. It is now testing the 50-day moving average, which has been the bullish trend line since April. A consolidation below it will sharply increase the chances of a deeper correction, and a failure below $112K — the area of recent lows — will confirm the correction, opening the potential for a decline to $105-107K.
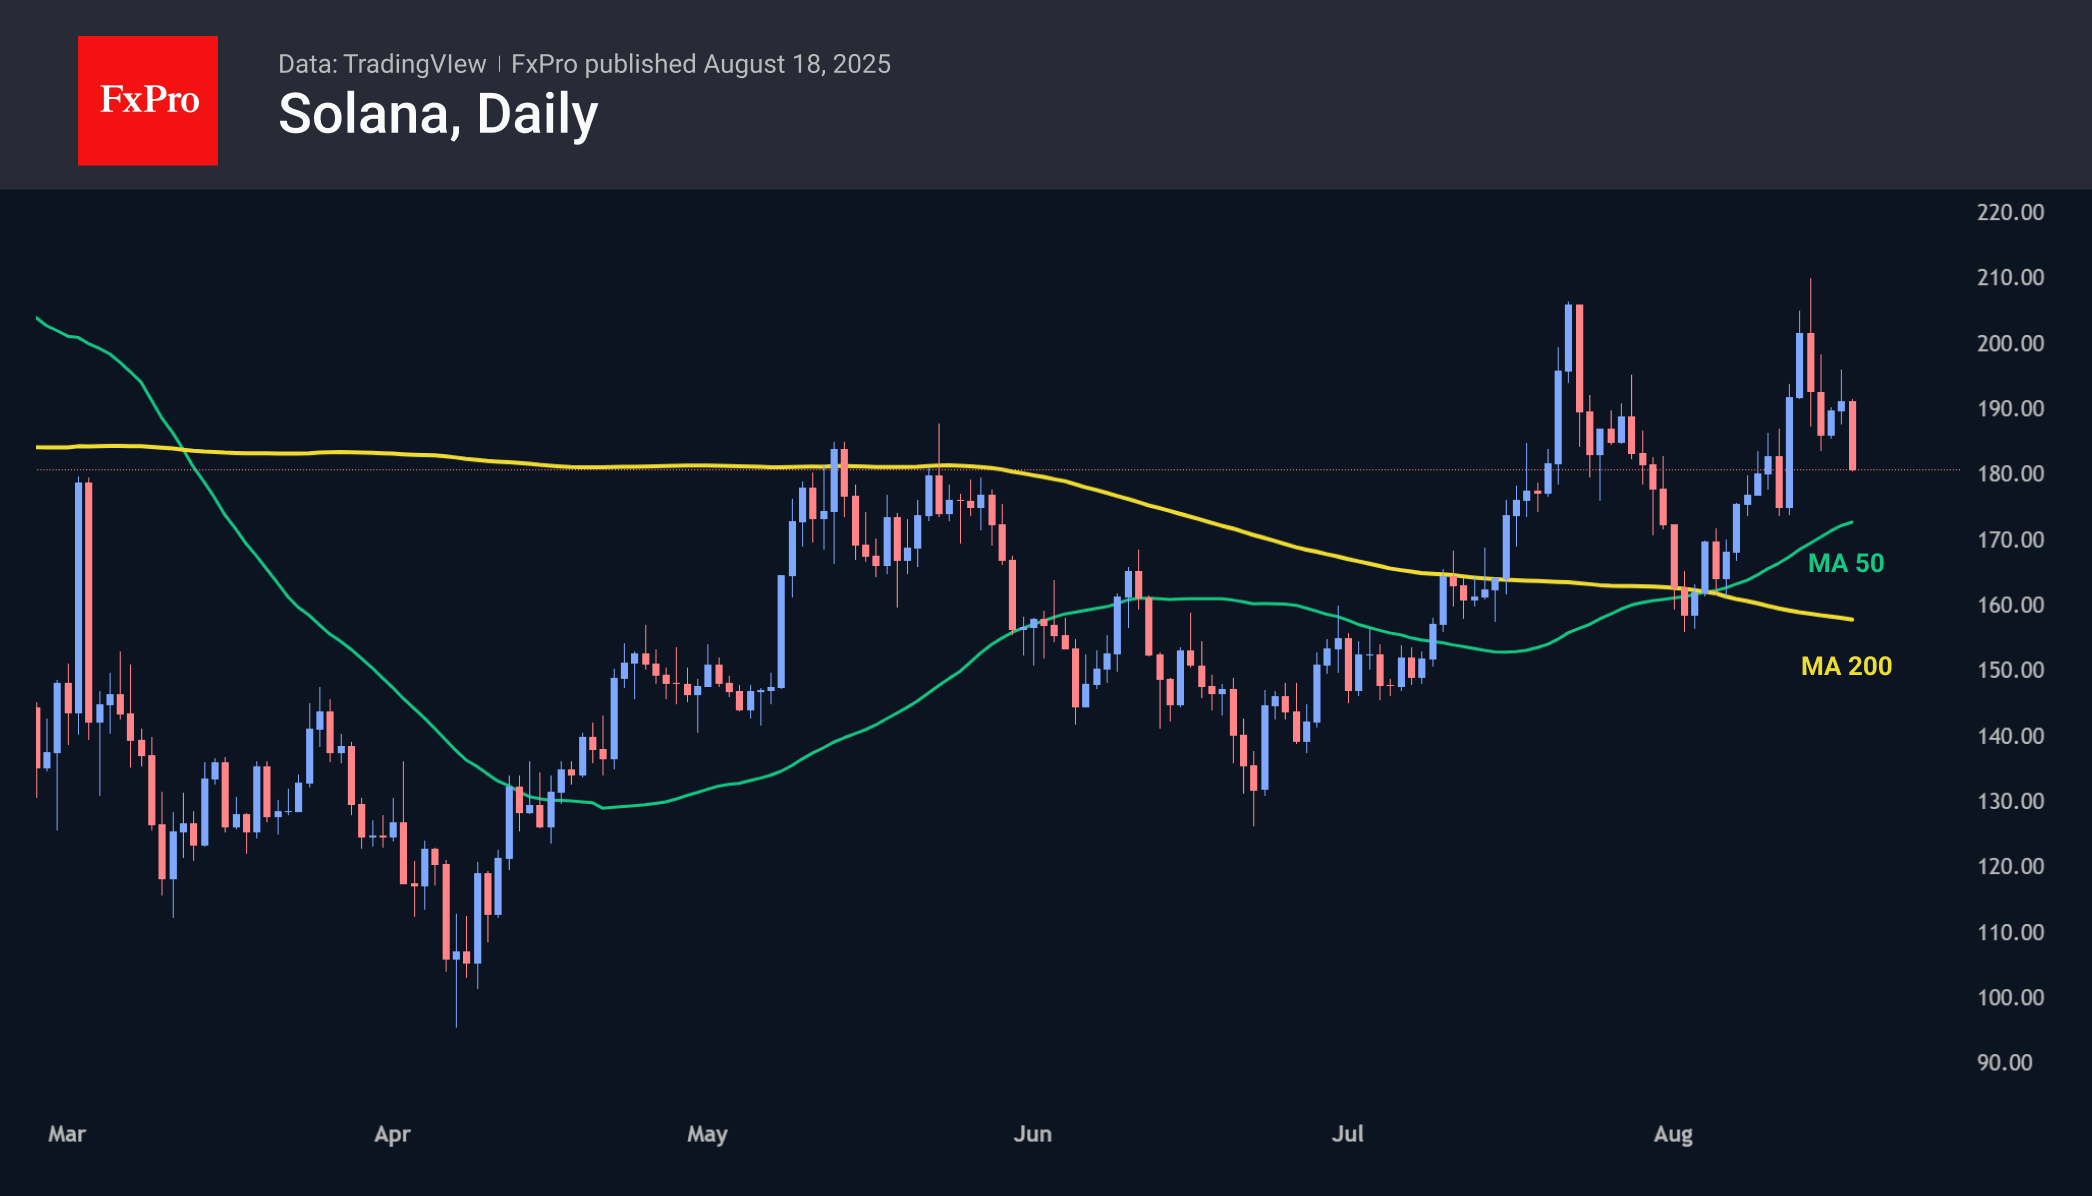
Solana is trading at $180, failing to consolidate above $210 for the second time in the last 30 days. Technically, it is worth watching the coin’s dynamics near the $170 and $160 levels, where the 50- and 200-day moving averages are located, respectively. A rebound from these levels could restore bullish sentiment, while a failure to break above them would signal internal weakness in the crypto market.
News Background
According to SoSoValue, net inflows into spot BTC ETFs rose to $547.8 million last week. Total inflows since the approval of Bitcoin ETFs in January 2024 have increased to $54.97 billion.
Weekly inflows into spot Ethereum ETFs in the US rose sharply to $2.85 billion, breaking the mid-July record. The positive trend has continued for 14 consecutive weeks. Total net inflows since the ETF’s launch in July 2024 have increased to $12.67 billion.
According to CryptoQuant, the inflow of stablecoins to Binance from large investors and institutions has reached one of the highest levels in recent months. This may indicate expectations of a new rally.
MN Trading founder Michael van de Poppe suggests that Bitcoin may decline a little further before consolidating. The key resistance level for a resumption of growth is $121,000. Glassnode considers $127,000 to be the key resistance level for BTC after it updated its highs.
Trader Nebraskangooner notes that the Bitcoin chart repeats the situation in November 2021, when the asset reached an all-time high of $69,000. Analyst Benjamin Cowen also believes that BTC shows the same pattern every year after halving: growth to the peak of the market cycle in the fourth quarter, followed by a bear market.
The FxPro Analyst Team