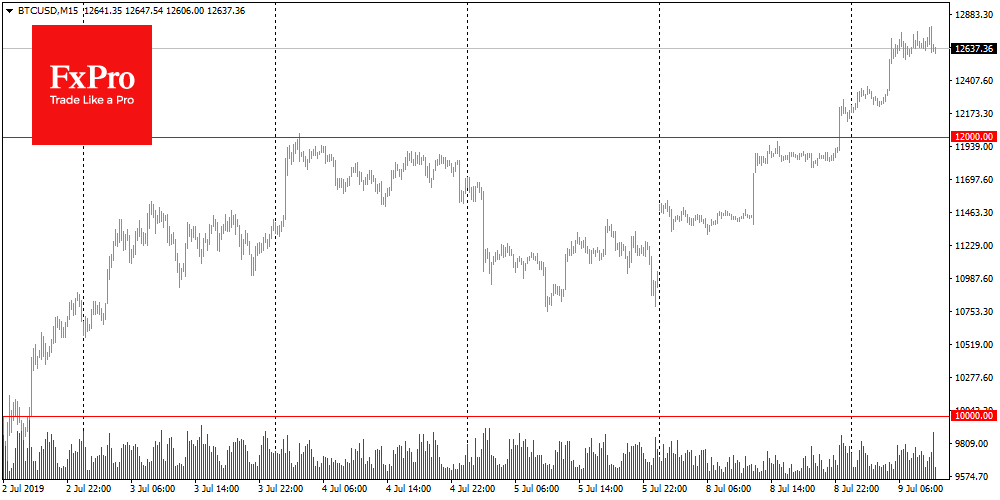
The price of Bitcoin spiked at night by more than $1,200, or almost 11% above $12,500. Along with the price, trading volumes also grew, which fundamentally supported a positive trend. The fact that Bitcoin was not allowed to decline below $10K and the asset constantly attracted consumer demand after waves of corrections, created room for growth for the benchmark cryptocurrency and attracted new buyers.
The Bitcoin price chart resembles a parabola, however, there are fundamental differences between what we saw in 2017 and today. Two years ago, the growth parabola was no longer interrupted above the $10K up to $18K. There was a painful excitement on the market, which ended in a collapse of prices. This can be explained: many then discovered this investment segment. Now it seems that the BTC is moving towards new goals as if in “in the standard operating mode”, making measured pauses for consolidation before a new breakthrough.
The FxPro Analyst Team