The British pound is losing for the third day in a row, having retreated to 1.2260. A technical look at the chart sets up for further declines with a renewal of the October lows with a dip under 1.20.

GBPUSD was in demand on dips under 1.2100 during October, which formed a bottom in the pair. At the beginning of the month, we saw a pick-up in buying following the global increase in risk appetite. But this week, the bulls have retreated.
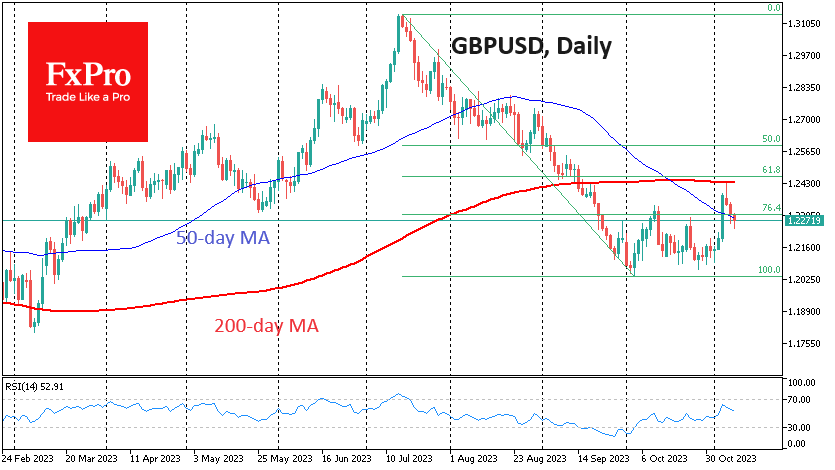
GBPUSD climbed to 1.2440 on Monday, but that touch of the 200-day moving average kicked off a sell-off that has continued for the third day. Keeping the pound below this technically important line makes it uninteresting for many big players, leaving it within a ‘sell the growth’ pattern.
In addition, the recent surge also fits within a Fibonacci retracement pattern. GBPUSD declined from 1.3140 in mid-July to 1.2030 in early October, and the latest corrective surge brought the pair very close to the 61.8% retracement levels. This may have helped the bears to recharge by removing the short-term oversold condition.
After a downward reversal at the start of the week, GBPUSD could reach 1.21, which is near local support, without many obstacles on the way. The pair’s dynamics in the 1.2060-1.2100 range could be an essential indicator of the bears’ seriousness. A quick drop below will open the way further to 1.1840 – near the lows of January and March. The long-term downside target for this cycle could be 1.1400.
The FxPro Analyst Team