
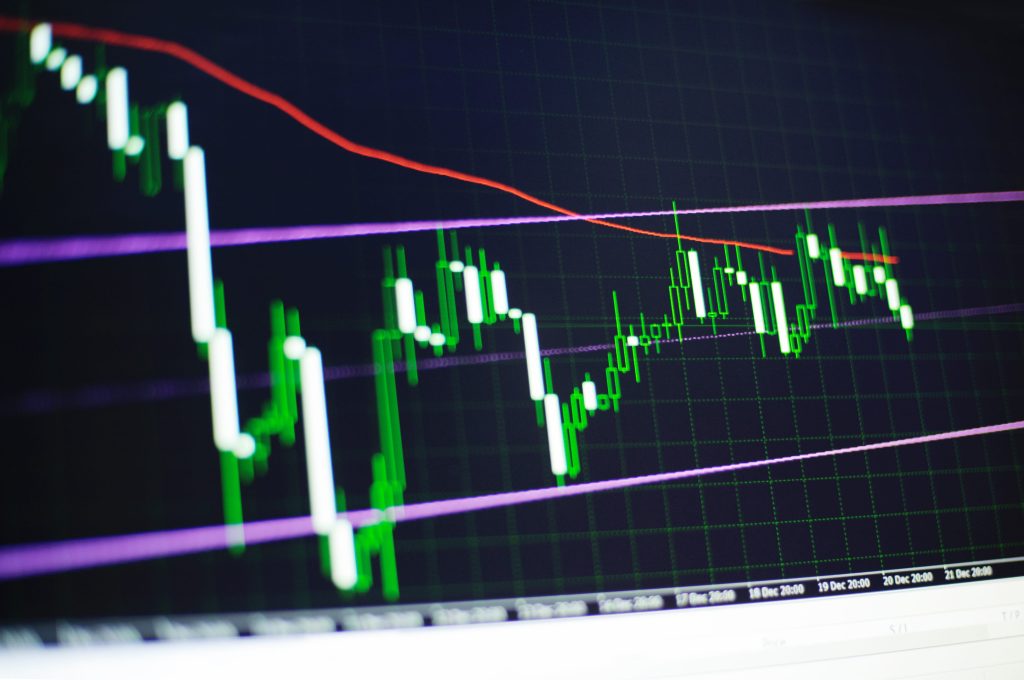
Learning how to read forex charts is one of the first practical skills worth developing when you begin trading currencies. Charts give forex traders a clear visual record of how a currency pair has moved over time, making it far easier to spot patterns and make more informed decisions. What are forex charts and how to read them? The answer is less complicated than it might first appear, and the basics are well within reach for anyone starting out.
Forex chart analysis forms the foundation of most trading approaches, regardless of your preferred style or time horizon. This guide walks you through the different chart types available, what each one tells you about price behaviour, and how to start reading them.
What is a forex trading chart?
A forex trading chart is a visual representation of a currency pair’s price movement over a selected period of time. It allows traders to see exactly how the price has behaved: where it opened, where it closed, and how far it moved in between. The ability to read different chart types gives you a meaningful advantage, as each one presents the same data in a slightly different way, revealing details that others might obscure.
Charts help you identify a trend, spot chart patterns, and assess whether buyers or sellers are currently in control of the market. By studying open and close prices alongside overall price movement, you can try to predict likely future behaviour with greater confidence and decide more clearly when and where to invest your capital or place a trade.
A sustained upward movement in price, where each peak sits higher than the last, signals growing buying pressure and a potential continuation of the trend, whereas a series of lower highs suggests sellers are gradually taking control and a reversal may be underway.
The different types of forex charts & how you read them
There are three main chart types used in forex trading, each offering a different view of price action in the market. The one you choose to use depends on your trading style and the level of detail you need:
Line charts
A line chart is the most straightforward of the three. It plots a single line across your chosen timeframe, connecting the closing price of each period to the next. The result is a clean, uncluttered view of how a currency pair has moved over time, without the additional detail that other charts show around opening prices or intraday highs and lows.
To read a line chart, focus on the overall shape of the line. A rising line indicates an uptrend, while a falling line points to a downtrend. It is particularly useful for identifying the broader direction of the market and locating support and resistance levels: areas where price has historically tended to reverse or pause, either finding a floor (support) or a ceiling (resistance). They are a practical starting point.
Candlestick charts
Candlestick charts are the most widely used chart type in forex trading. Each candle represents price movement over a specific period, showing the open, close, high, and low in a single visual block. A green candlestick indicates that the price closed higher than it opened, reflecting buying pressure, while a red candlestick shows that the price closed lower, reflecting selling pressure.
Reading candlesticks involves looking at both individual candles and the patterns they form together. A long green candle following a period of decline, for example, can be one signal of a potential reversal. Over time, you will begin to recognise recurring formations that suggest where the price is likely to head next. Their visual clarity makes them a preferred tool for traders at every level of experience.
Bar Charts (OHLC)
A bar chart, also known as an OHLC chart, displays the highest and lowest prices reached during a given period, alongside the opening and closing prices. Each bar consists of a vertical line representing the full price range, with a small horizontal dash on the left indicating the open and another on the right indicating the close.
Bar charts carry the same information as candlestick charts but present it in a more compact, less visual format. To read them, look at the relationship between the left and right ticks. If the right tick sits above the left, the price closed higher than it opened during that period. They are particularly useful for traders who prefer a cleaner chart without the filled bodies that candlesticks produce, while still retaining the full detail of each period’s price movement.
Forex charts and technical analysis
By studying historical price data displayed on a chart, you can identify patterns, trends, and key levels that help inform your trading decisions. However, you should still follow economic releases and central bank statements, which often explain the why, while charts tell you what the price is doing.
Charts are the primary analytical instrument through which technical analysis is applied. Whether you are using candlestick, bar, or even mountain charts for a broader overview, each one gives you a different lens through which to read market behaviour and build a view on where price may be heading.
This approach works across different timeframes, making it equally relevant for those taking longer-term positions and those focused on short-term setups. The more familiar you become with reading charts, the more naturally you will start to spot the signals that experienced traders act on every day.
To sum up
Reading forex charts is a skill that develops steadily with practice and exposure. The more time you spend studying price behaviour across different chart types and timeframes, the more naturally patterns and signals begin to stand out. It is a foundational part of trading that becomes more valuable at every stage of your development, whether you are just starting out or refining an existing approach.
At FxPro, our platforms give you access to a full suite of charting tools designed to support your analysis from day one. Open a trading account today and start putting your chart-reading skills to work in live market conditions.
Please note this is educational material, and should not be considered as a recommendation or trading advice.
Trade Responsibly. CFDs are complex instruments and come with a high risk of losing money rapidly due to leverage. 76% of retail investor accounts lose money when trading CFDs with this provider. You should consider whether you understand how CFDs work and whether you can afford to take the high risk of losing your money.