

Technical analysis
WTI Wave Analysis – 09 August, 2019
August 09, 2019 @ 17:58 +03:00

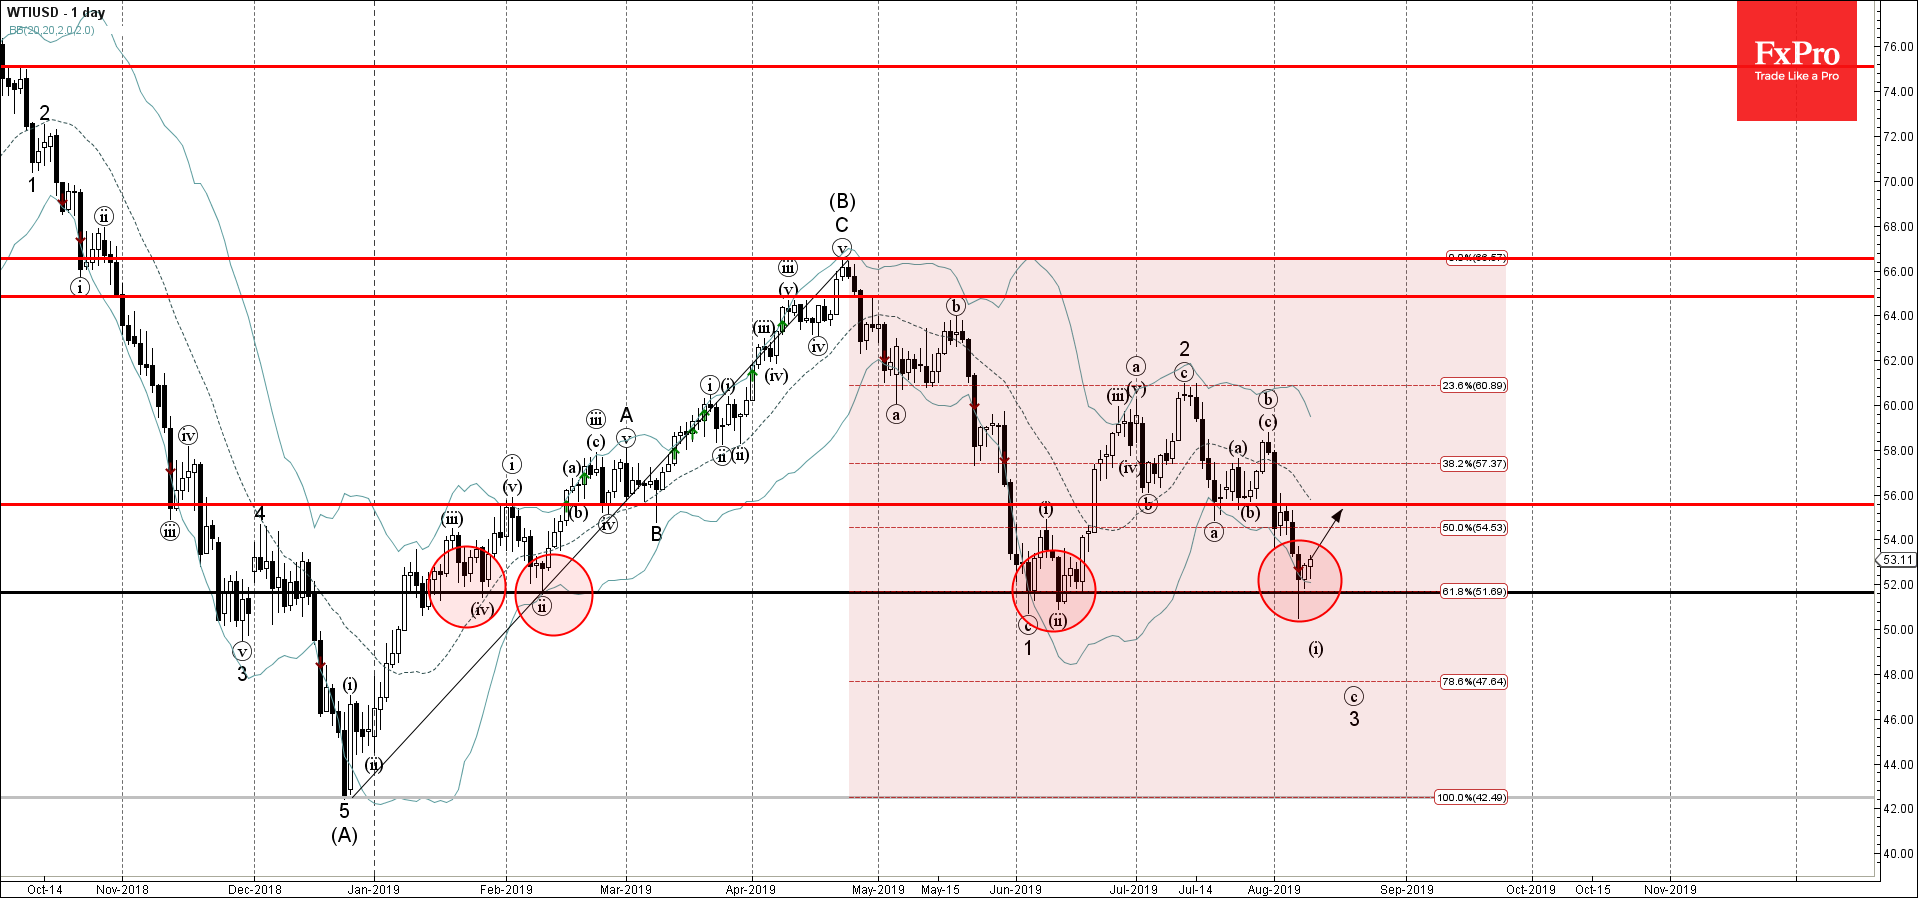
- WTI reversed from support zone
- Further gains are likely
WTI recently reversed up sharply from the support zone lying between the multi-month support level 52.00 (which has been reversing the price from January) and the lower daily Bollinger Band.
This support zone was further strengthened by the 61.8% Fibonacci correction of the previous ABC correction (B) from December.
WTI is expected to rise further and retest the next resistance level 56.00 (former strong support from July).
Related Articles

EURJPY Wave Analysis 18 April 2024
April 18, 2024 @ 23:09 +03:00

EURUSD Wave Analysis 18 April 2024
April 18, 2024 @ 23:08 +03:00

WTI Wave Analysis 17 April 2024
April 17, 2024 @ 22:40 +03:00

EURGBP Wave Analysis 17 April 2024
April 17, 2024 @ 22:38 +03:00