

Technical analysis
Wheat Wave Analysis – 27 January, 2020
January 27, 2020 @ 18:56 +03:00

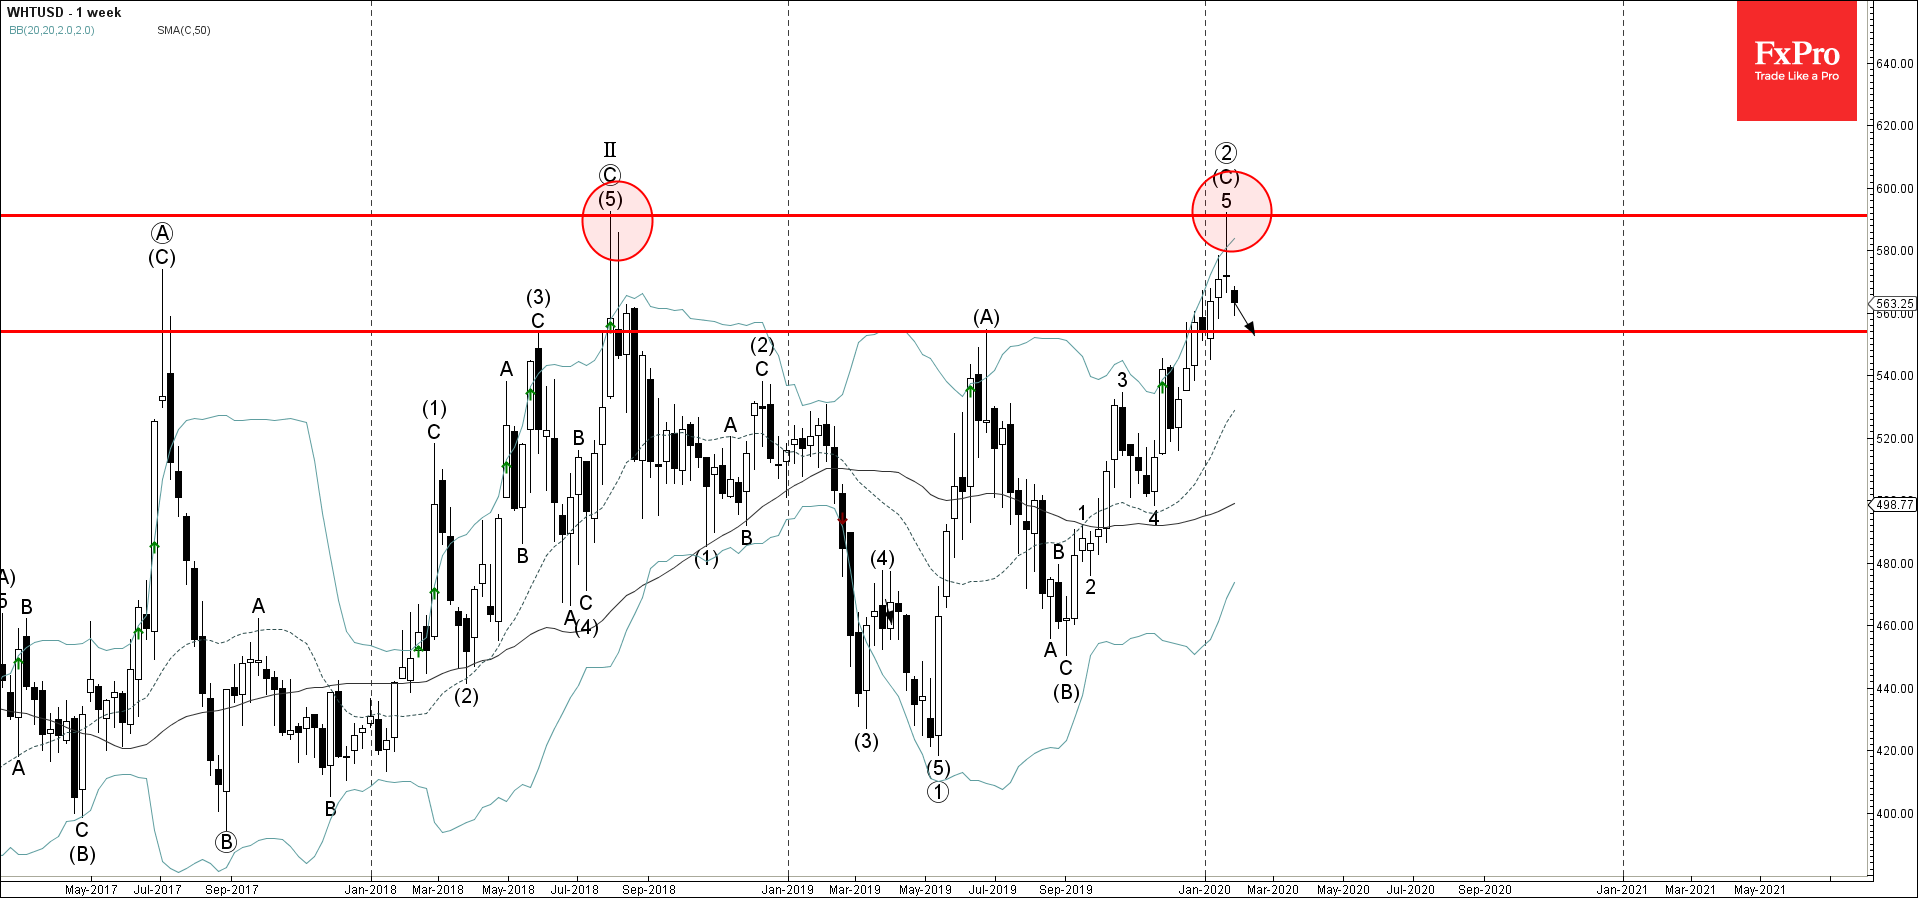
- Wheat reversed from resistance area
- Likely to fall to 553.80
Wheat recently reversed down sharply from the powerful resistance area lying between the multi-year resistance level 590.00 (which reversed the sharp uptrend in the middle of 2018) and the upper weekly Bollinger Band.
The downward reversal from this resistance area created the strong weekly Japanese candlesticks reversal pattern Shooting Star Doji – very strong sell signal for Wheat.
Wheat is likely to fall further toward the next support level 553.80 (former multi-month high from last year).
Related Articles

Intel Wave Analysis 19 April 2024
April 19, 2024 @ 22:12 +03:00

GBPUSD Wave Analysis 19 April 2024
April 19, 2024 @ 22:11 +03:00

EURJPY Wave Analysis 18 April 2024
April 18, 2024 @ 23:09 +03:00

EURUSD Wave Analysis 18 April 2024
April 18, 2024 @ 23:08 +03:00