

Technical analysis
USDJPY Wave Analysis 12 October, 2020
October 12, 2020 @ 11:51 +03:00

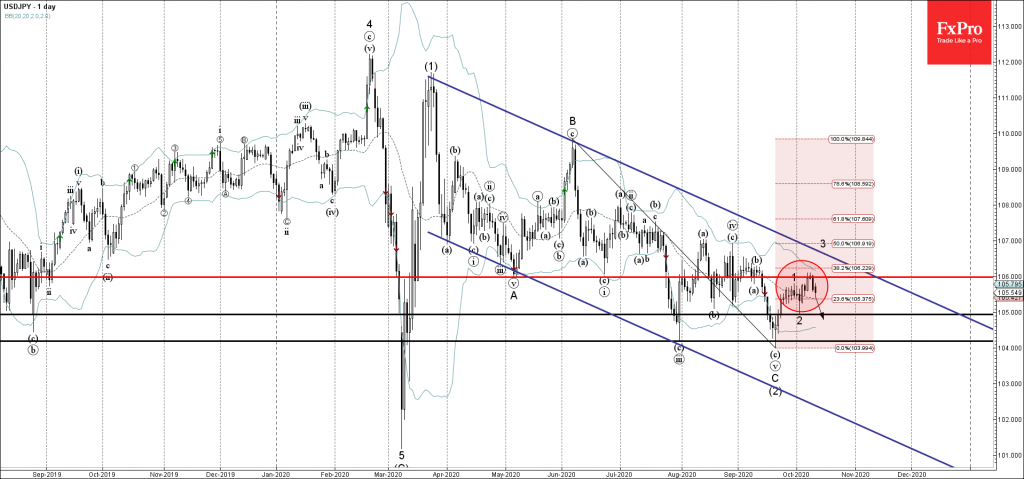
• USDJPY reversed from resistance area
• Likely to fall 105.00
USDJPY recently reversed down with the daily Evening Star from the resistance area lying between the resistance level 106.00, upper daily Bollinger band and the 38.2% Fibonacci correction of the downward impulse from June.
The downward reversal from this resistance area stopped the previous short-term impulse wave 3.
USDJPY is likely to fall further toward the next support level 105.00 (low of the previous minor corrective wave 2).
Related Articles

GBPCAD Wave Analysis 25 April 2024
April 25, 2024 @ 20:10 +03:00

GBPAUD Wave Analysis 25 April 2024
April 25, 2024 @ 20:09 +03:00

EURGBP Wave Analysis 24 April 2024
April 24, 2024 @ 21:42 +03:00

EURJPY Wave Analysis 24 April 2024
April 24, 2024 @ 21:40 +03:00