

Technical analysis
USDCHF Wave Analysis – 20 July, 2020
July 20, 2020 @ 17:25 +03:00

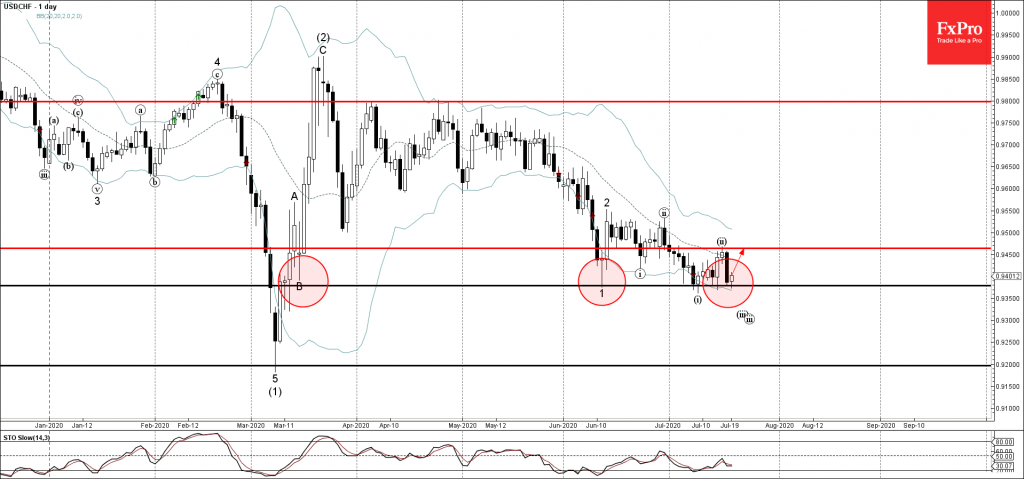
• USDCHF reversed from level 0.9380
• Likely to rise to 0.9465
USDCHF recently reversed up from the key support level 0.9380 (which has been reversing the price from the middle of March, as can be seen from the daily USDCHF chart below).
The support area neat the support level 0.9380 is strengthened by the lower daily Bollinger Band.
Given the clear bullish divergence on the daily Stochastic indicator – USDCHF is likely to rise further toward the next resistance level 0.9465 (top of the previous corrective wave (ii)).
Related Articles

EURJPY Wave Analysis 18 April 2024
April 18, 2024 @ 23:09 +03:00

EURUSD Wave Analysis 18 April 2024
April 18, 2024 @ 23:08 +03:00

WTI Wave Analysis 17 April 2024
April 17, 2024 @ 22:40 +03:00

EURGBP Wave Analysis 17 April 2024
April 17, 2024 @ 22:38 +03:00