

Technical analysis
USDCAD Wave Analysis – 22 May, 2019
May 22, 2019 @ 18:49 +03:00

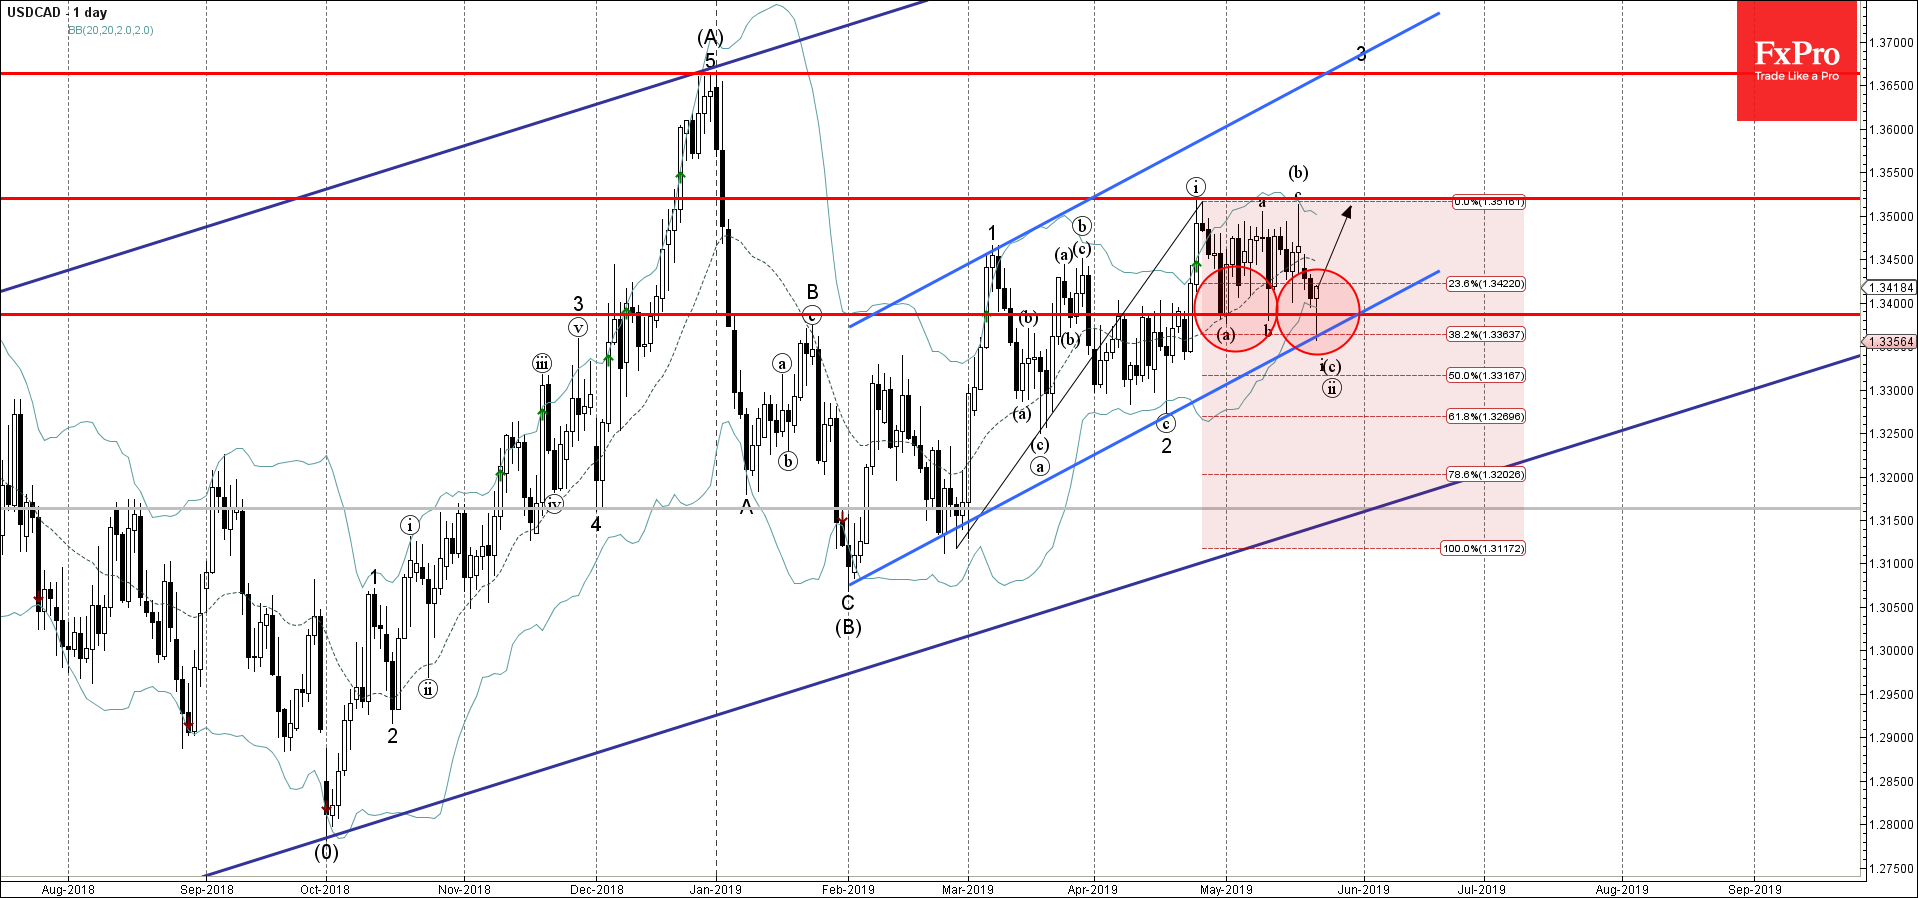
- USDCAD reversed from support area
- Further gains are likely
USDCAD today reversed up with the daily Hammer from the support area lying between the key support level 1.3390 (which has been reversing the price from the start of May) and the lower daily Bollinger Band.
This support area was further strengthened by the support trendline of the daily up channel from February and by the 38.2% Fibonacci correction of the upward impulse form February.
USDCAD is expected to rise further and retest the next resistance level 1.3520 (top of the previous waves (i) and (b)).
Related Articles

USDJPY Wave Analysis 26 April 2024
April 27, 2024 @ 00:00 +03:00

Ebay Wave Analysis 26 April 2024
April 26, 2024 @ 23:59 +03:00

GBPCAD Wave Analysis 25 April 2024
April 25, 2024 @ 20:10 +03:00

GBPAUD Wave Analysis 25 April 2024
April 25, 2024 @ 20:09 +03:00