

The Euro’s oversold is a sign for more volatility to come
November 25, 2021 @ 17:10 +03:00
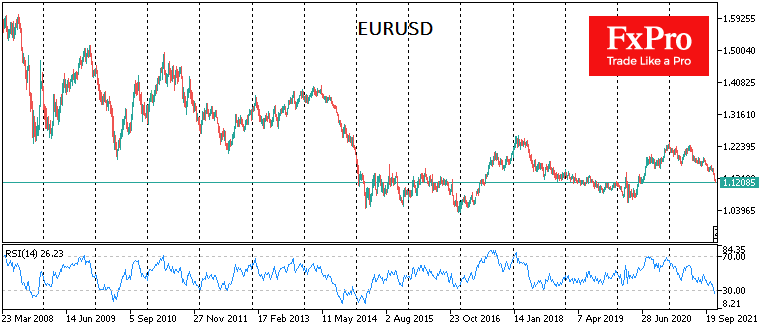
The Euro fell against the dollar to 1.1200, a new 16-month low, having lost more than 4% in the last four weeks. The downward trend in the single currency accelerated in November on the divergence between Fed and ECB policies.
And the latest news on business activity from Europe reinforces this divergence by feeding the bears in a single currency. The recovery in Europe appears to have peaked in May and June, after which business sentiment indicators are methodically falling. The latest data from Germany’s Ifo marked the fifth consecutive month of deteriorating business conditions, driven by logistical problems, the energy crisis in Europe and a rise in coronavirus cases, followed by stricter lockdown measures.
Technically, on the weekly candlestick charts, the EURUSD is oversold as last seen in 2015. Often this is a precursor for some recovery. However, historically for EURUSD, this oversold signal means we may see a further acceleration of the downside and increased volatility ahead. In 2014, 2010, 2008 and 1996, the dip of the RSI below 30 on the weekly charts followed the acceleration collapse, sometimes taking almost a free fall form.
In those cases, the signal for a reversal was a rebound of the indicator above the oversold level (i.e. higher than 30), signalling the end of the sell-off in the Euro. It can take a long time between these points, e.g., in 2014-2015, it took more than half a year for the EURUSD exchange rate to collapse by 18%.
The multi-year and repeatedly tested EURUSD support level is located around 1.07, and that is where the Euro could end up in the next six months. This will be especially true if economic growth in the Eurozone slows down while bond yields rise. These are conditions we are currently experiencing.
The FxPro Analyst Team

April 24, 2024 @ 21:42 +03:00

April 24, 2024 @ 21:40 +03:00

April 23, 2024 @ 22:47 +03:00

April 23, 2024 @ 22:46 +03:00