

Technical analysis
Sugar Wave Analysis – 4 June, 2019
June 04, 2019 @ 18:21 +03:00

- Sugar reversed from support area
- Further gains are likely
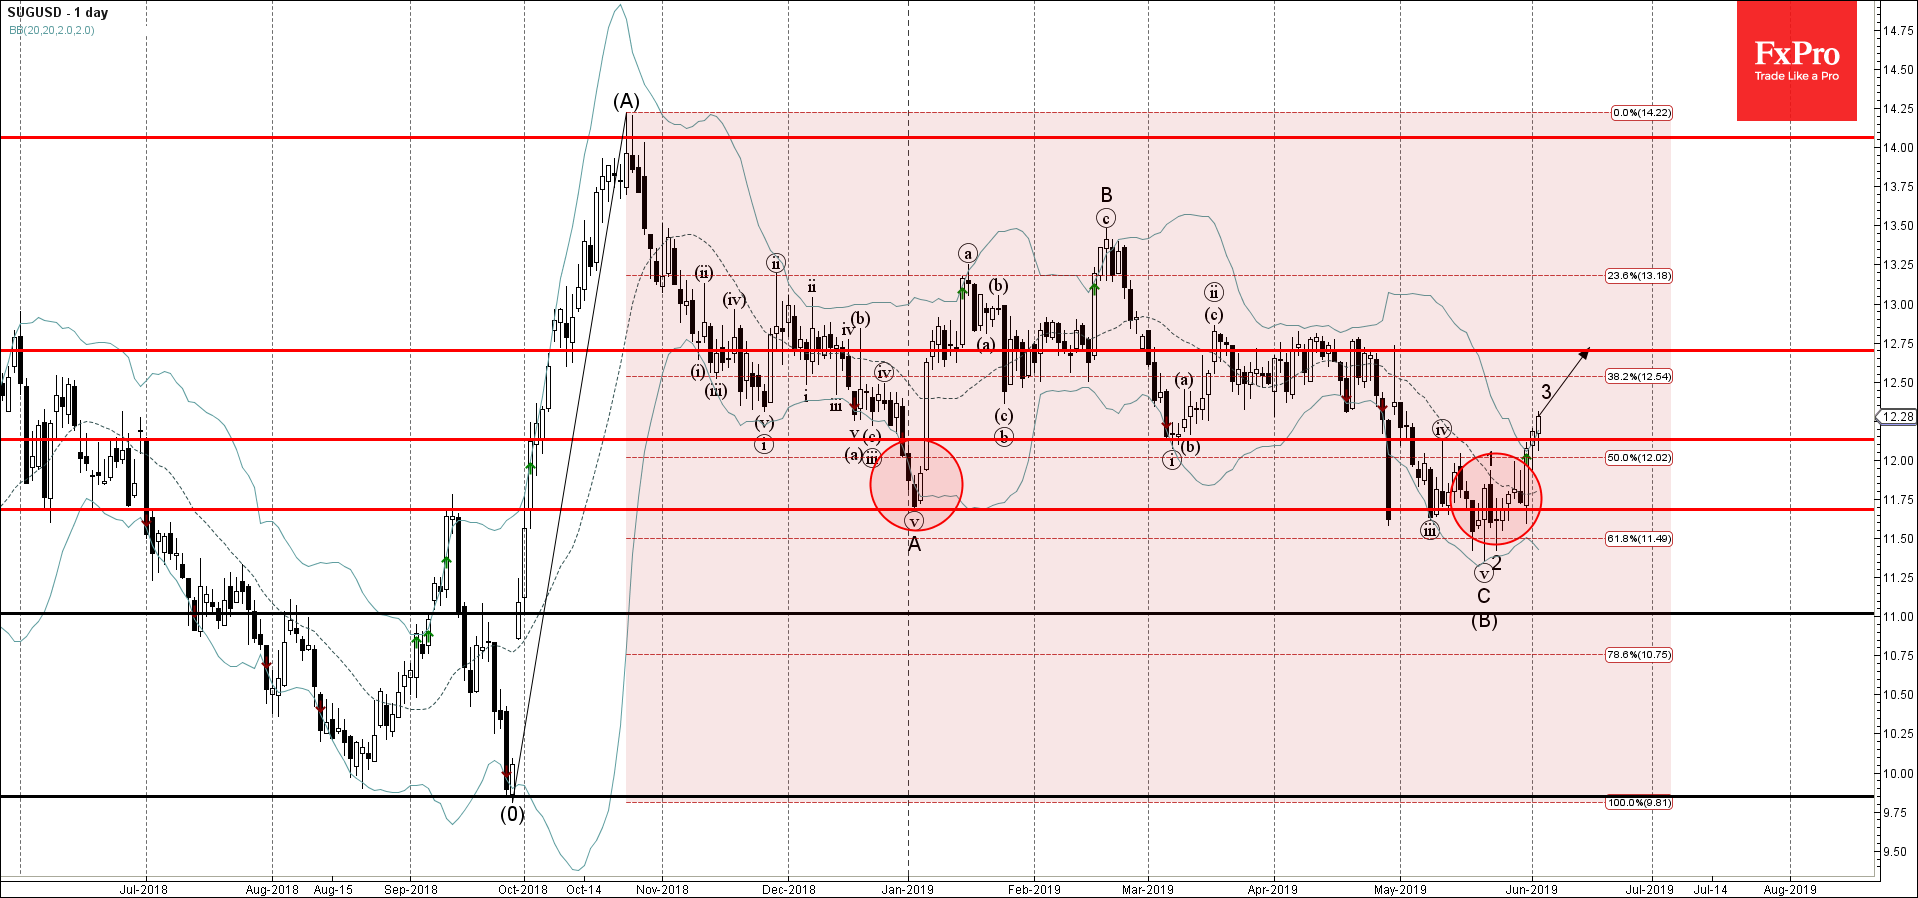
Sugar recently reversed up from the support area lying between the key support level 11.75 (former monthly low from January), lower daily Bollinger Band and the 61.8% Fibonacci correction of the previous upward impulse from last September.
The upward reversal from this support area stopped the earlier extended ABC correction (B).
Sugar is expected to rise further in the active impulse waves 3 and (C) and retest the next resistance level 12.75 (which repeatedly reversed the price in April).
Related Articles

Intel Wave Analysis 19 April 2024
April 19, 2024 @ 22:12 +03:00

GBPUSD Wave Analysis 19 April 2024
April 19, 2024 @ 22:11 +03:00

EURJPY Wave Analysis 18 April 2024
April 18, 2024 @ 23:09 +03:00

EURUSD Wave Analysis 18 April 2024
April 18, 2024 @ 23:08 +03:00