

Technical analysis
Sugar Wave Analysis – 30 July, 2019
July 30, 2019 @ 17:09 +03:00

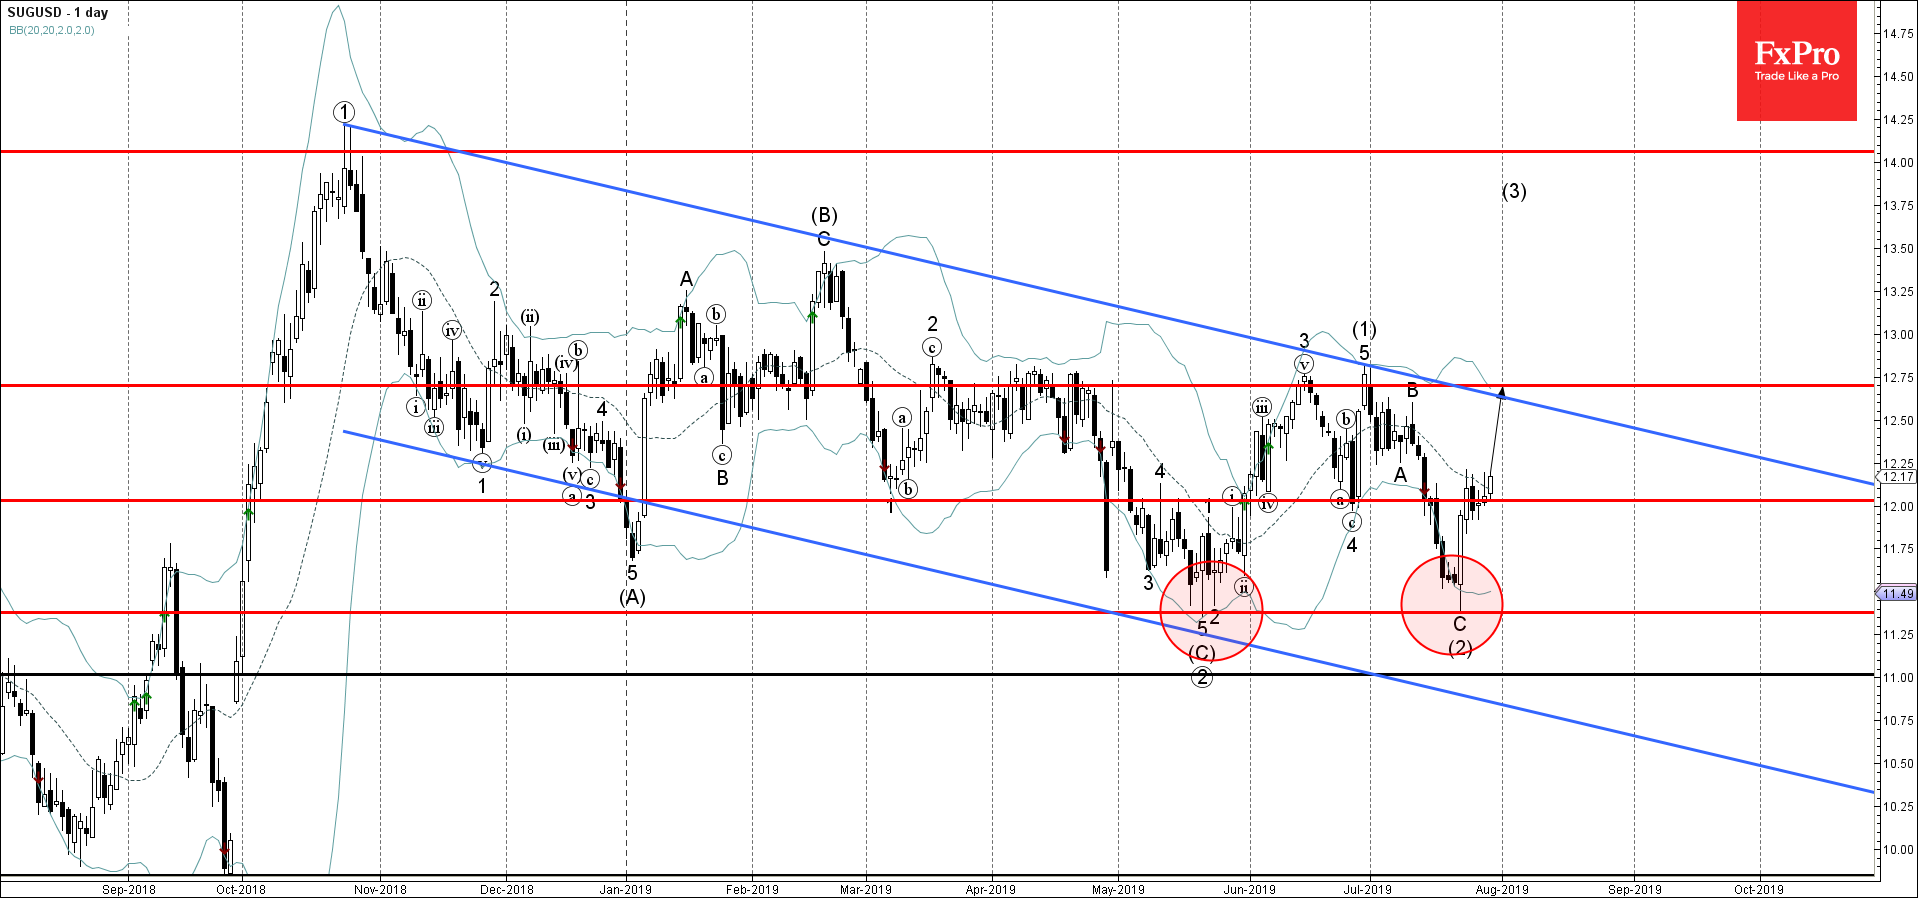
- Sugar reversed from support zone
- Further gains are likely
Sugar recently reversed up sharply from the support zone lying between the key support level 11.40 (monthly low from May) and the lower daily Bollinger Band.
The upward reversal from this support zone started the active medium-term impulse wave (3).
Sugar is expected to rise further and retest the next resistance level 12.750 – which coincides with the resistance trendline of the daily down channel from last October.
Related Articles

GBPCAD Wave Analysis 25 April 2024
April 25, 2024 @ 20:10 +03:00

GBPAUD Wave Analysis 25 April 2024
April 25, 2024 @ 20:09 +03:00

EURGBP Wave Analysis 24 April 2024
April 24, 2024 @ 21:42 +03:00

EURJPY Wave Analysis 24 April 2024
April 24, 2024 @ 21:40 +03:00