

Technical analysis
Sugar Wave Analysis – 21 October, 2019
October 21, 2019 @ 17:01 +03:00

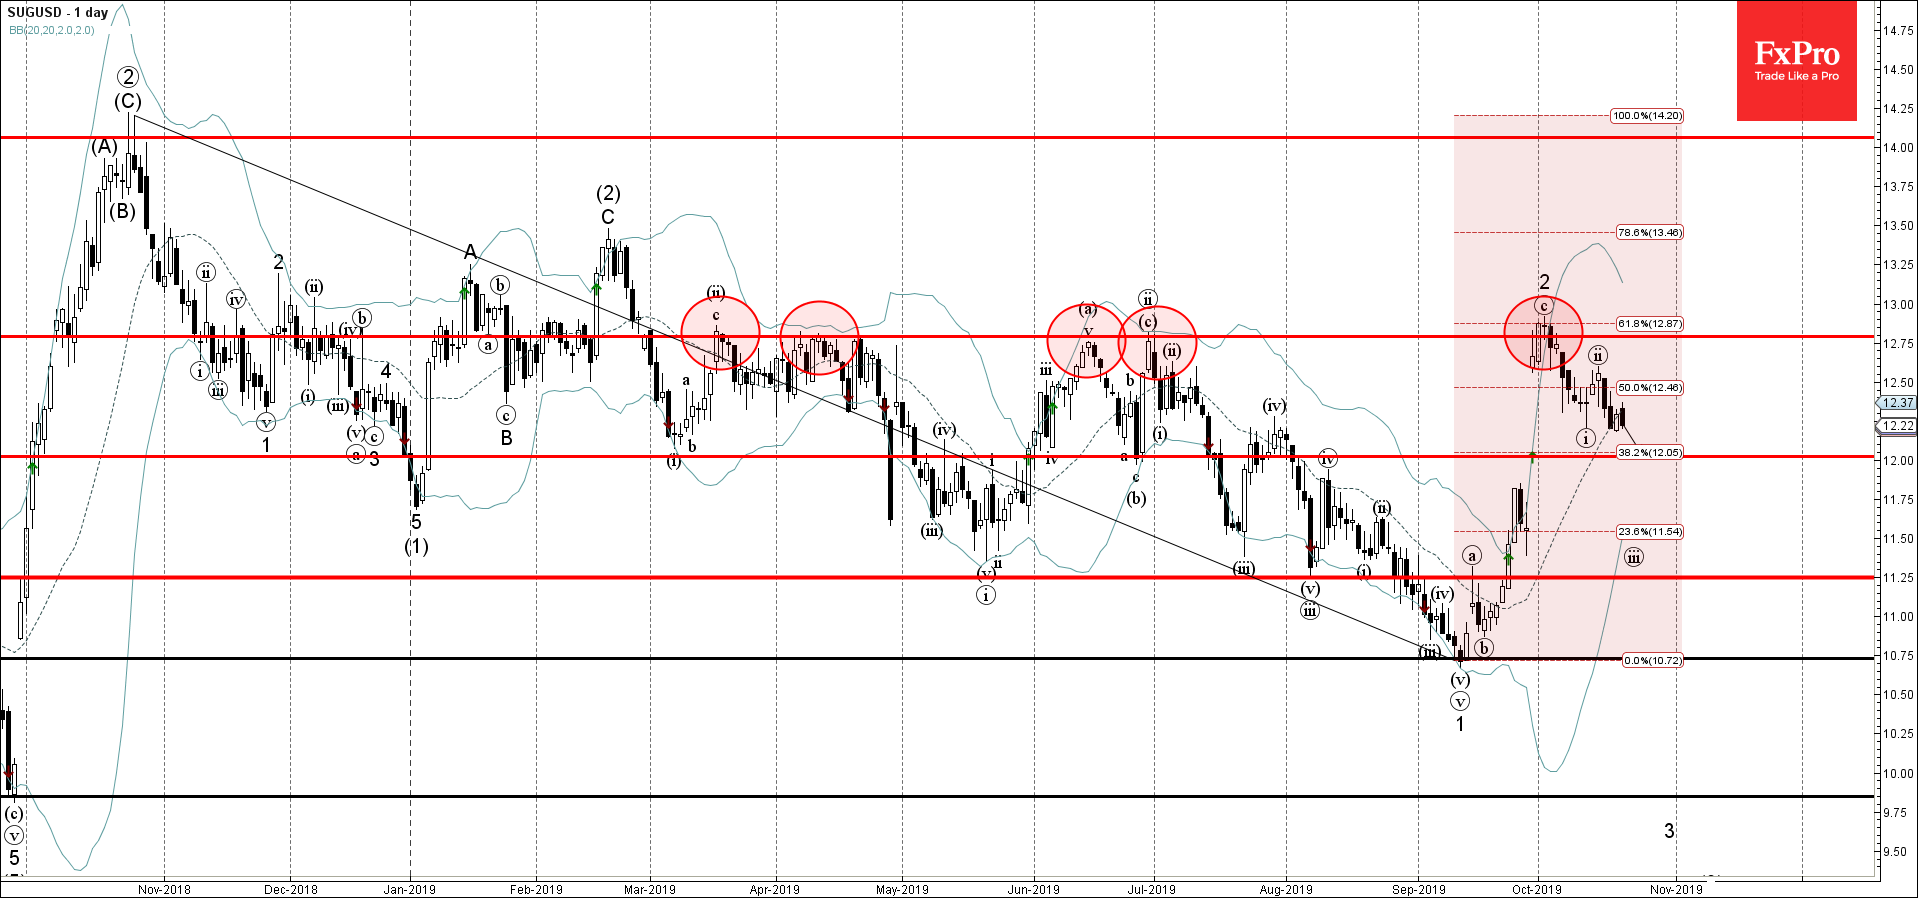
- Sugar falling inside impulse wave 3
- Likely to fall to 12.00
Sugar continues to fall inside the short-term impulse wave 3 which started earlier from the powerful resistance level 12.80 (which has been reversing the price from March).
The resistance zone near the resistance level 12.80 was strengthened by the upper daily Bollinger Band and by the 61.8% Fibonacci correction of the earlier downtrend from October of 2018.
Sugar is expected to fall further and retest the next support level 12.00 (former resistance from August).
Related Articles

Intel Wave Analysis 19 April 2024
April 19, 2024 @ 22:12 +03:00

GBPUSD Wave Analysis 19 April 2024
April 19, 2024 @ 22:11 +03:00

EURJPY Wave Analysis 18 April 2024
April 18, 2024 @ 23:09 +03:00

EURUSD Wave Analysis 18 April 2024
April 18, 2024 @ 23:08 +03:00