

Technical analysis
Sugar Wave Analysis – 17 September, 2019
September 17, 2019 @ 15:28 +03:00

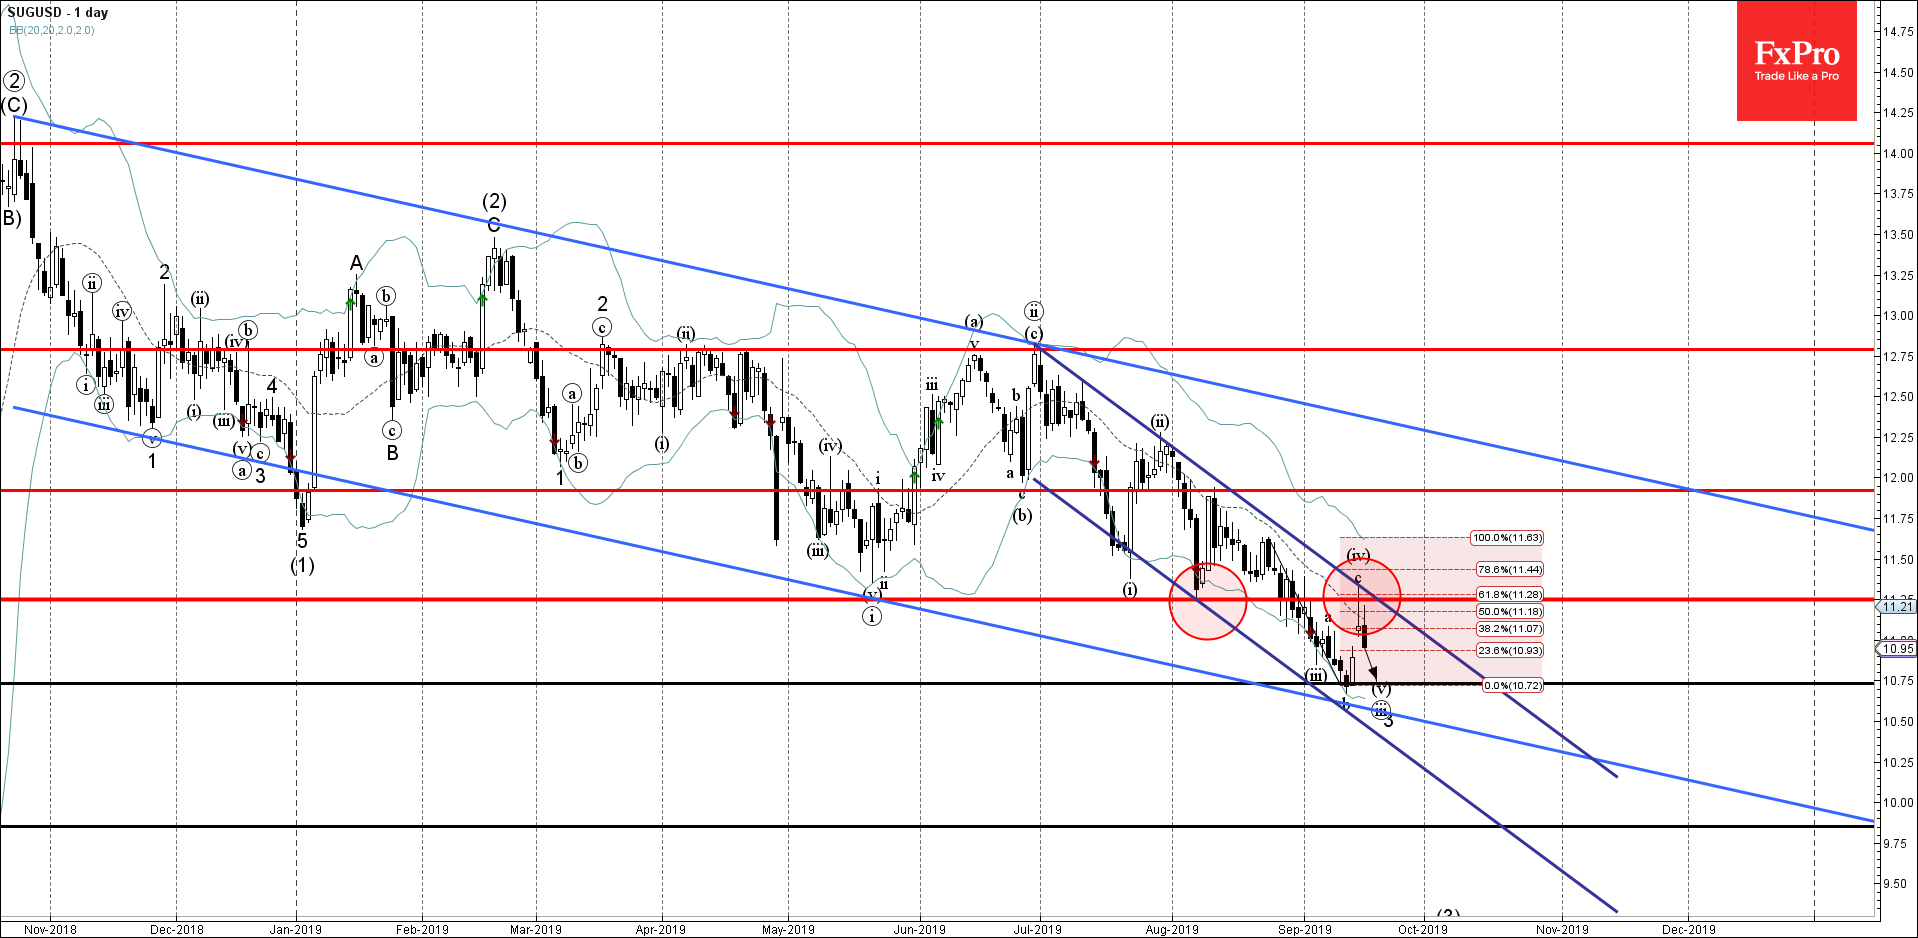
- Sugar reversed from resistance zone
- Further losses are likely
Sugar recently reversed down with the daily Falling Star from the resistance zone lying between the resistance level 11.25 (former strong support from August), upper resistance trendline of the daily down channel from June and the 61.8% Fibonacci correction of the previous downward impulse from August.
The downward reversal from this resistance zone started the active short-term impulse wave (v) – which belongs to wave 3 from March.
Sugar is expected to fall further and retest the next support level 10.75 (low of the previous Morning Star from the start of September).
Related Articles

EURJPY Wave Analysis 18 April 2024
April 18, 2024 @ 23:09 +03:00

EURUSD Wave Analysis 18 April 2024
April 18, 2024 @ 23:08 +03:00

WTI Wave Analysis 17 April 2024
April 17, 2024 @ 22:40 +03:00

EURGBP Wave Analysis 17 April 2024
April 17, 2024 @ 22:38 +03:00