

Technical analysis
Soy Wave Analysis 30 November, 2020
November 30, 2020 @ 18:43 +03:00

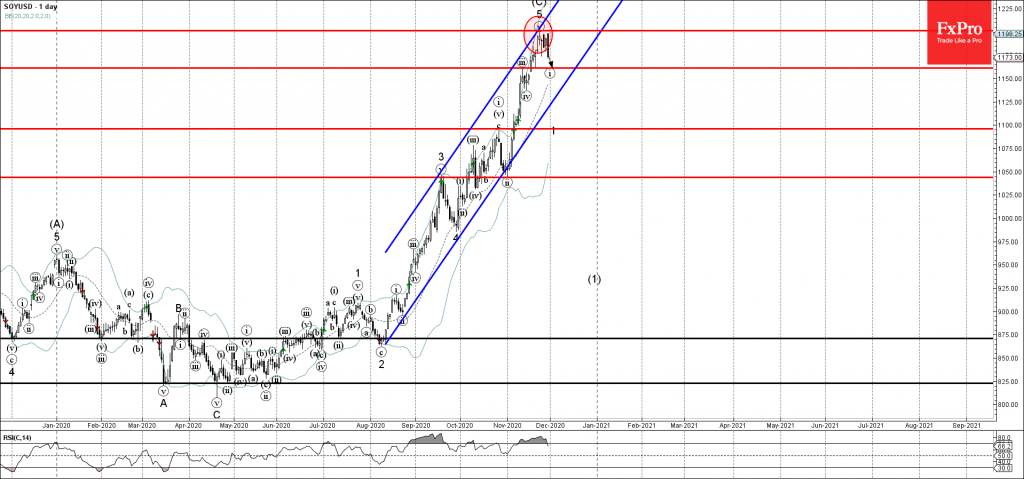
• Soy reversed from long-term resistance level 1200.00
• Likely to correct down to 1200.00
Soy recently reversed down from the key resistance level 1200.00 (former multi-year high from the middle of 2016) intersecting with the upper daily and weekly Bollinger Bands.
The downward reversal from the resistance level 1200.00 started the active short-term downward impulse wave (i).
Given the strength of the resistance level 1200.00 and the overbought daily RSI – Soy is expected to fall further toward the next support level 1160.00 (target price for the completion of the active impulse wave (i)).
Related Articles

Intel Wave Analysis 19 April 2024
April 19, 2024 @ 22:12 +03:00

GBPUSD Wave Analysis 19 April 2024
April 19, 2024 @ 22:11 +03:00

EURJPY Wave Analysis 18 April 2024
April 18, 2024 @ 23:09 +03:00

EURUSD Wave Analysis 18 April 2024
April 18, 2024 @ 23:08 +03:00