

Technical analysis
Soy Wave Analysis – 30 July, 2020
July 30, 2020 @ 17:50 +03:00

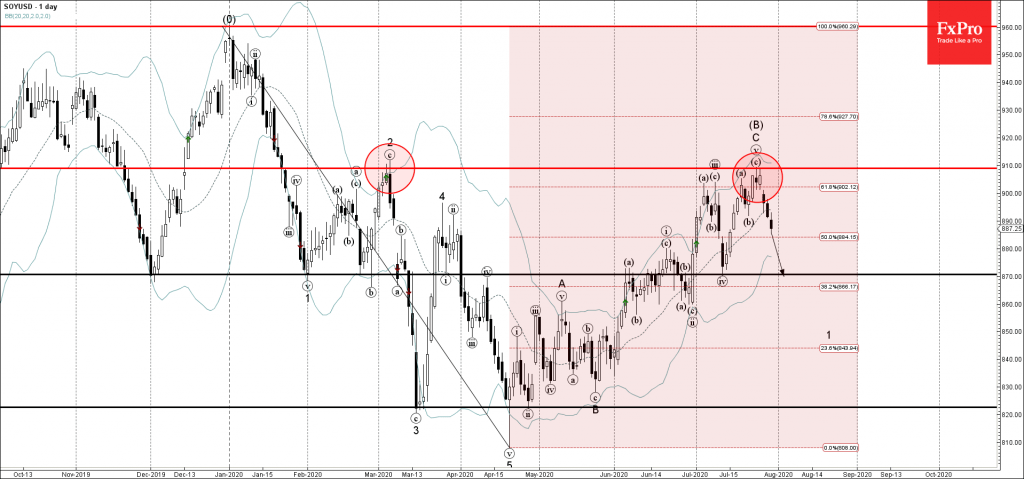
• Soy falling inside waves 1 and (C)
• Likely to fall to 870,00
Soy continues to fall inside the sharp downward impulse wave 1 which started earlier from the resistance zone set between the long-term resistance level 910,00 (monthly high from March), upper daily Bollinger Band and the 61,8% Fibonacci retracement of the sharp wave (A) from January.
The active impulse wave 1 is a part of the higher-order downward impulse sequence (C).
Soy is likely to fall down further toward the next support level 870,00 (low of the previous minor correction (iv)).
Related Articles

Intel Wave Analysis 19 April 2024
April 19, 2024 @ 22:12 +03:00

GBPUSD Wave Analysis 19 April 2024
April 19, 2024 @ 22:11 +03:00

EURJPY Wave Analysis 18 April 2024
April 18, 2024 @ 23:09 +03:00

EURUSD Wave Analysis 18 April 2024
April 18, 2024 @ 23:08 +03:00