

Technical analysis
Soy Wave Analysis – 15 July, 2019
July 15, 2019 @ 18:33 +03:00

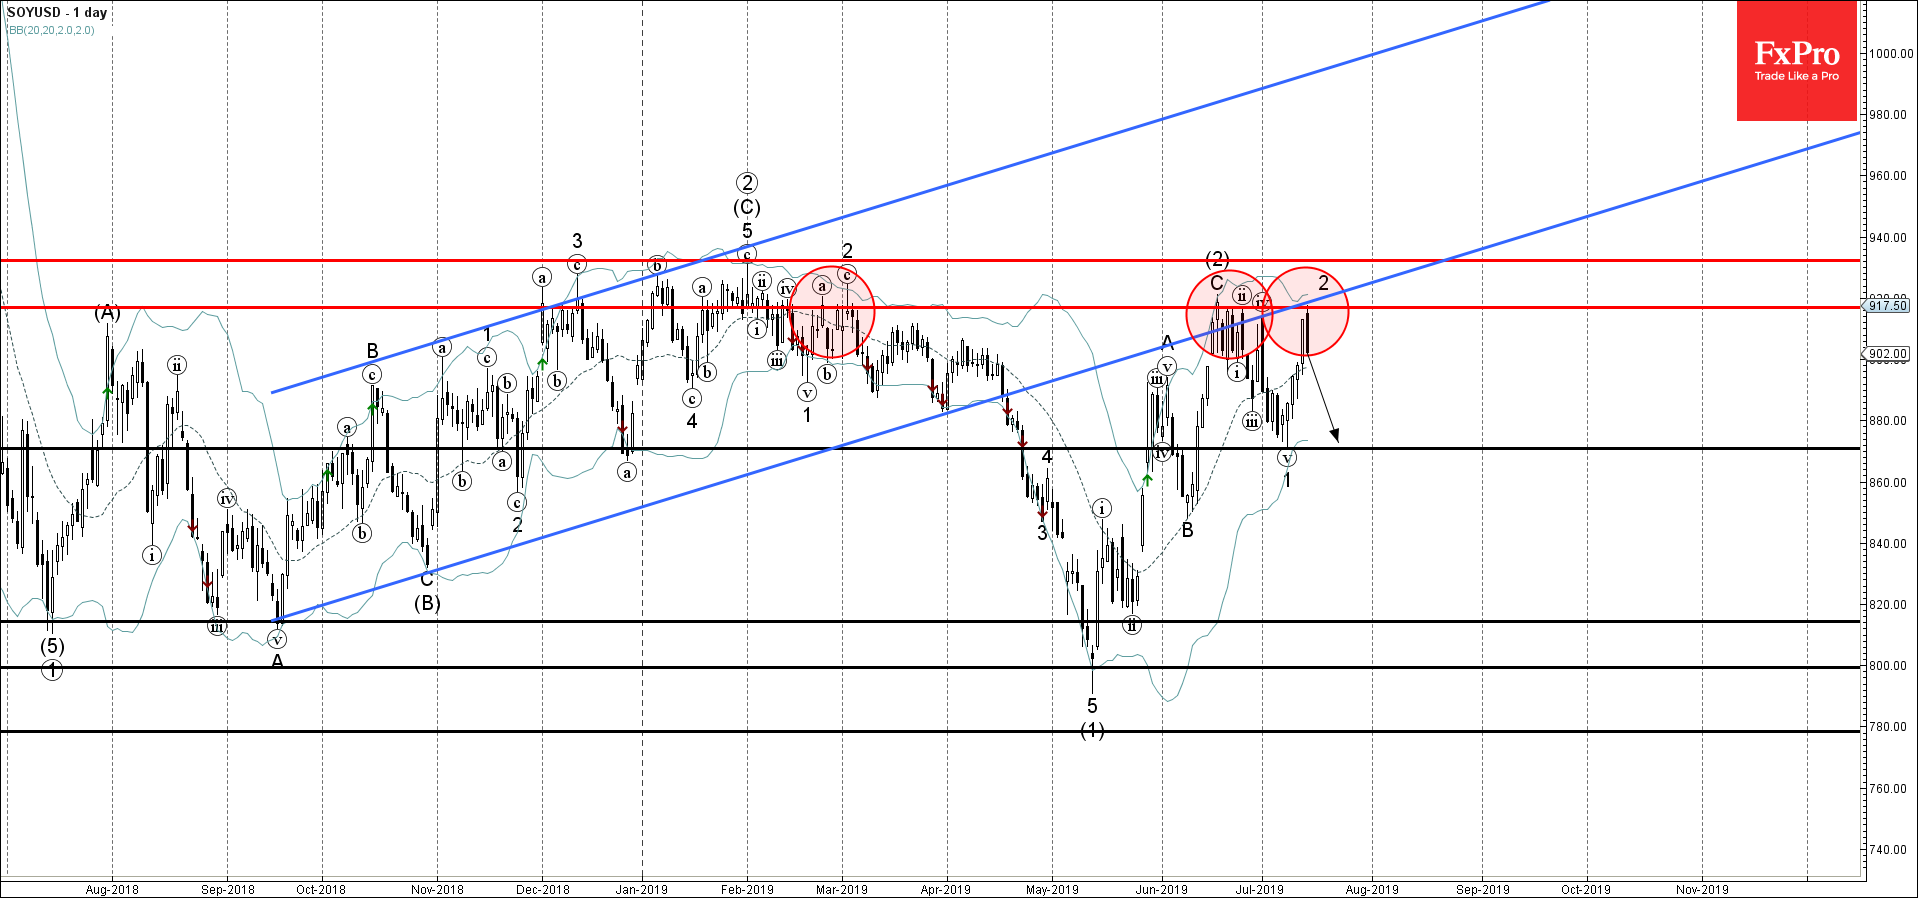
- Soy reversed from resistance area
- Further losses are likely
Soy recently reversed down from the resistance area lying between the key resistance level 917.00 (which also reversed the price in June), lower trendline of the daily up channel from September and the upper daily Bollinger Band.
The downward reversal from this resistance area stopped the earlier short-term correction 2.
Soy is expected to fall further and retest the next support level 870.00 (low of the previous impulse wave 1).
Related Articles

Intel Wave Analysis 19 April 2024
April 19, 2024 @ 22:12 +03:00

GBPUSD Wave Analysis 19 April 2024
April 19, 2024 @ 22:11 +03:00

EURJPY Wave Analysis 18 April 2024
April 18, 2024 @ 23:09 +03:00

EURUSD Wave Analysis 18 April 2024
April 18, 2024 @ 23:08 +03:00