

Technical analysis
Soy Wave Analysis – 01 November, 2019
November 01, 2019 @ 17:06 +03:00

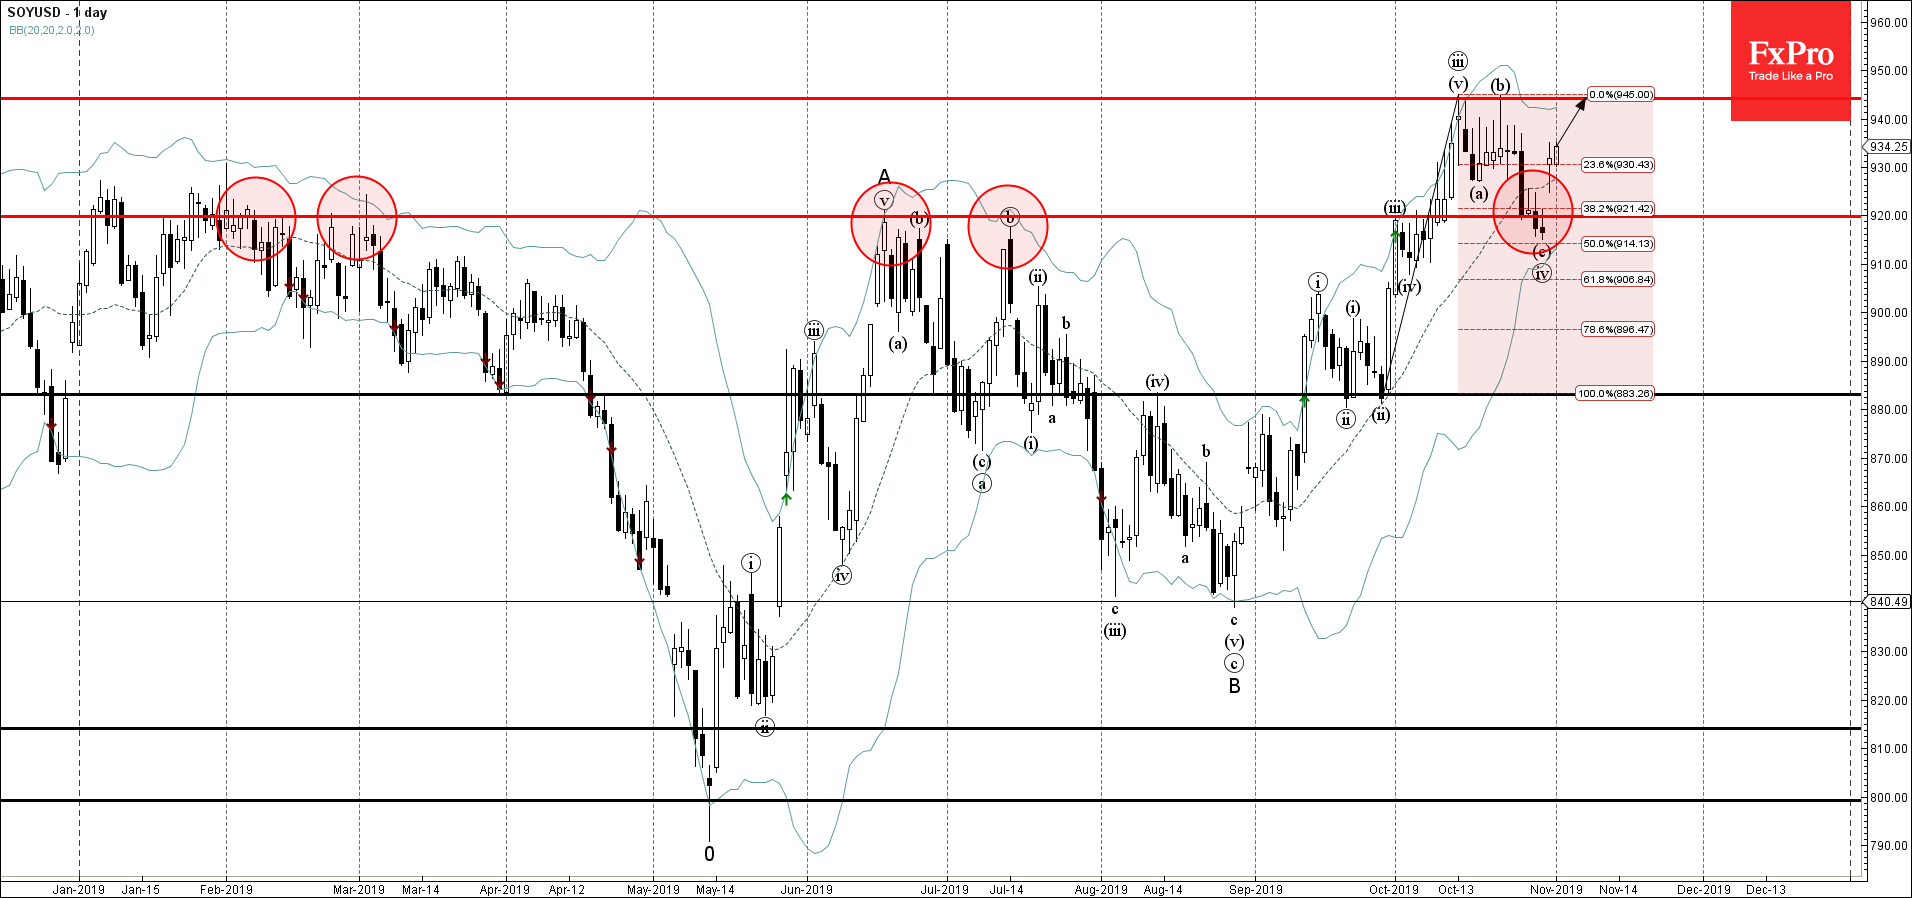
- Soy reversed from support zone
- Likely to rise to 944.00
Soy recently reversed up sharply from the support zone lying between the key support level 920.00 (former multi-month resistance level which has been reversing the price from February), lower daily Bollinger Band and the 38,2% Fibonacci correction of the previous upward impulse from September.
The upward reversal from this support area started the active short-term impulse wave (v).
Soy is expected to rise further and retest the next resistance level – 944.00 (which stopped the previous waves (iii) and (b)).
Related Articles

EURGBP Wave Analysis 24 April 2024
April 24, 2024 @ 21:42 +03:00

EURJPY Wave Analysis 24 April 2024
April 24, 2024 @ 21:40 +03:00

WTI crude oil Wave Analysis 23 April 2024
April 23, 2024 @ 22:47 +03:00

USDCAD Wave Analysis 23 April 2024
April 23, 2024 @ 22:46 +03:00