

Technical analysis
Procter & Gamble Wave Analysis – 20 February, 2020
February 21, 2020 @ 16:54 +03:00
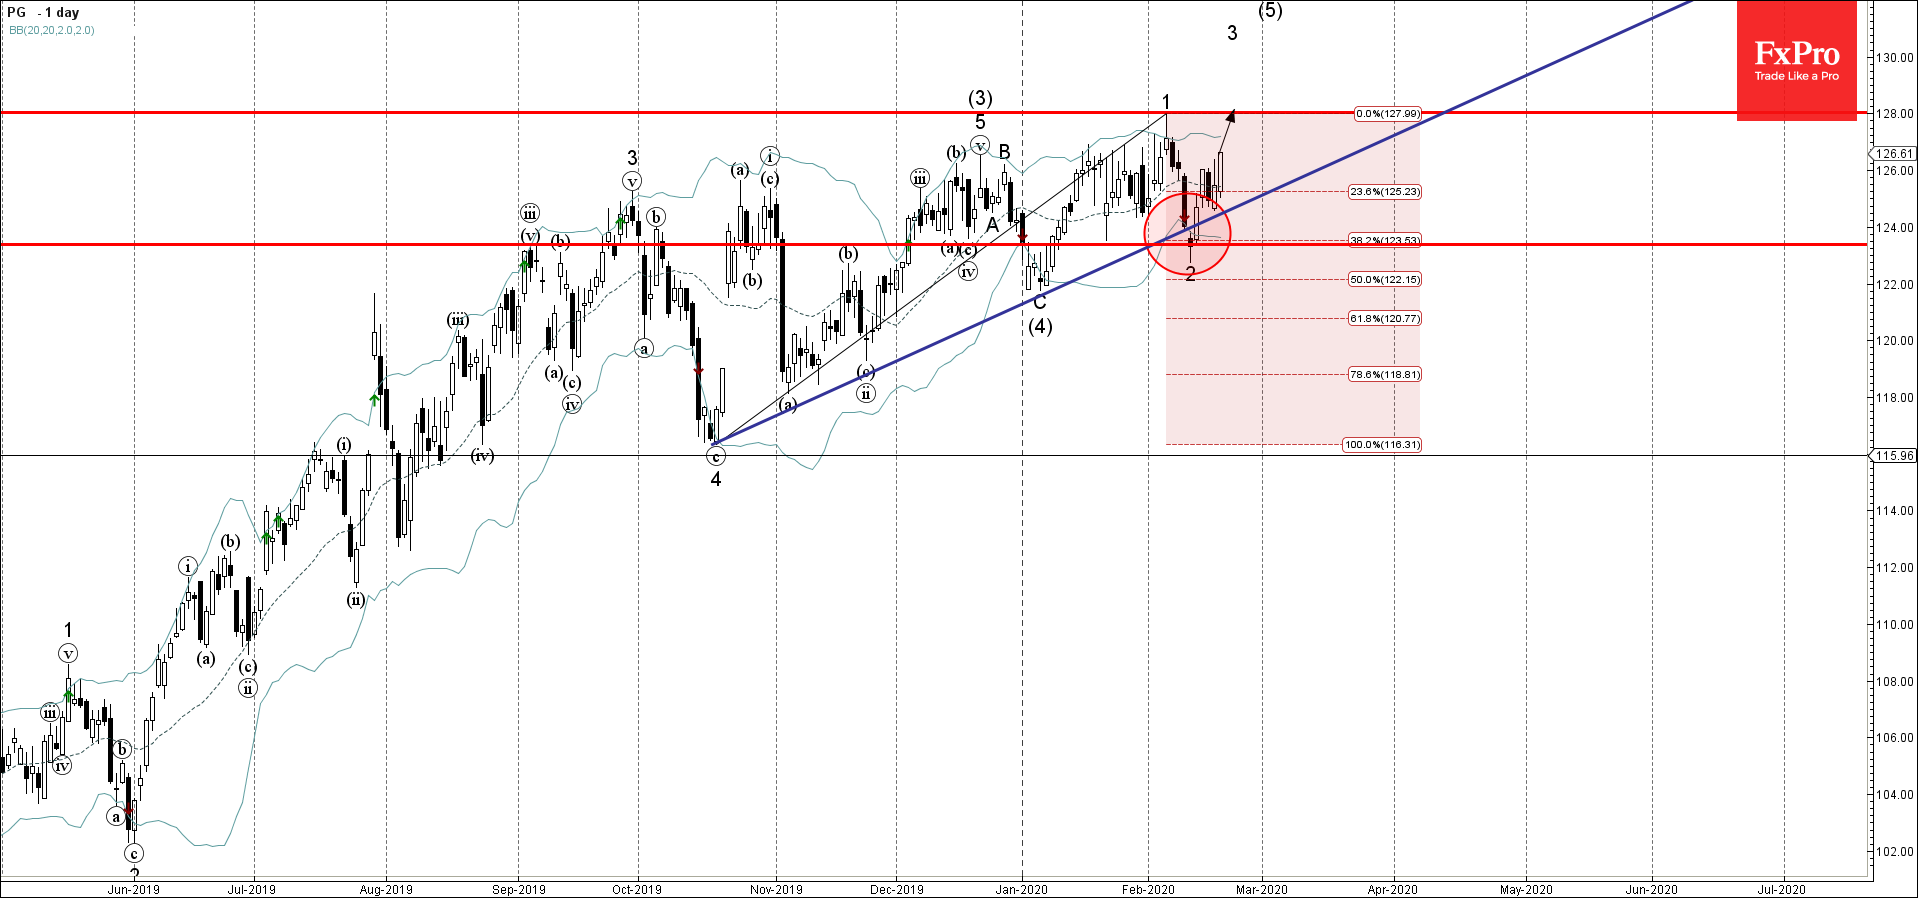
- Procter & Gamble reversed from support area
- Likely to rise to 128.00
Procter & Gamble recently reversed up sharply from the support area lying between the key support level 123.40 (low of the previous correction from January), lower daily Bollinger Band, 38.2% Fibonacci retracement of the previous upward impulse from October and the support trendline from last year.
The upward reversal from this resistance area created the daily reversal pattern Morning Star – which started the active impulse wave 3.
Procter & Gamble is likely to rise further toward the next resistance level 128.00 (top of the previous short-term impulse wave 1).
Related Articles

Intel Wave Analysis 19 April 2024
April 19, 2024 @ 22:12 +03:00

GBPUSD Wave Analysis 19 April 2024
April 19, 2024 @ 22:11 +03:00

EURJPY Wave Analysis 18 April 2024
April 18, 2024 @ 23:09 +03:00

EURUSD Wave Analysis 18 April 2024
April 18, 2024 @ 23:08 +03:00