

Technical analysis
NZDCHF Wave Analysis 9 October, 2020
October 09, 2020 @ 11:13 +03:00

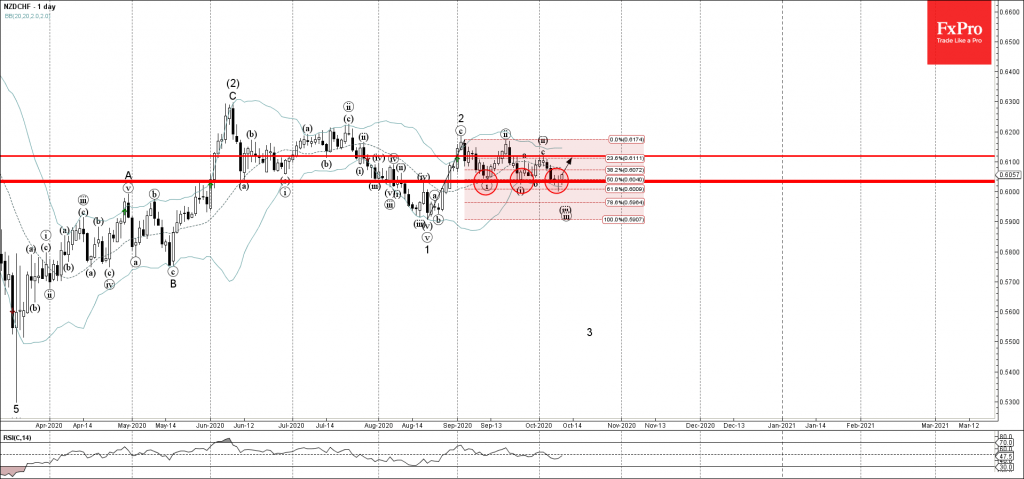
• NZDCHF reversed from support area
• Likely to rise to 0.6120
NZDCHF recently reversed up from the support area lying between the key support level 0.6030 (which has been reversing the price from the middle of September) and the lower daily Bollinger Band.
The support zone near the support level 0.6030 was further strengthened by the 61.8% Fibonacci correction level of the previous upward correction 2 from August.
NZDCHF is likely to rise further toward the next resistance level 0.6120 (top of the previous short-term correction (ii)).
Related Articles

EURGBP Wave Analysis 24 April 2024
April 24, 2024 @ 21:42 +03:00

EURJPY Wave Analysis 24 April 2024
April 24, 2024 @ 21:40 +03:00

WTI crude oil Wave Analysis 23 April 2024
April 23, 2024 @ 22:47 +03:00

USDCAD Wave Analysis 23 April 2024
April 23, 2024 @ 22:46 +03:00