

Technical analysis
NZDCHF Wave Analysis 13 November, 2020
November 13, 2020 @ 18:23 +03:00

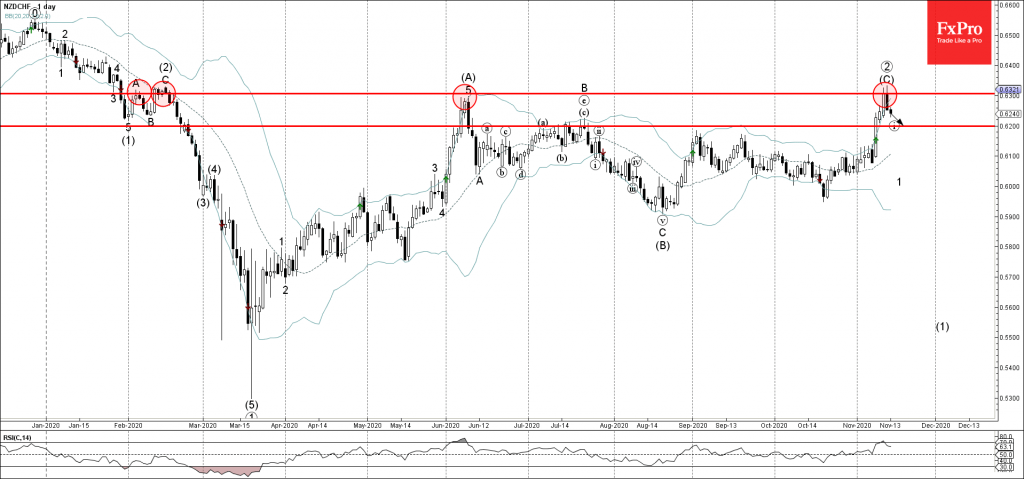
• NZDCHF reversed from resistance zone
• Likely to fall to 0.6200
NZDCHF recently reversed down from the powerful resistance zone located between the long-term resistance level 0.6300 (which has been reversing the price from February) and the upper daily Bollinger Band.
The downward reversal from this resistance zone created the daily Bearish Engulfing – which started the active short-term impulse wave 1.
NZDCHF is likely to fall down further toward the next support level 0.6200 (target price for the termination of the active minor impulse wave (i)).
Related Articles

GBPCAD Wave Analysis 25 April 2024
April 25, 2024 @ 20:10 +03:00

GBPAUD Wave Analysis 25 April 2024
April 25, 2024 @ 20:09 +03:00

EURGBP Wave Analysis 24 April 2024
April 24, 2024 @ 21:42 +03:00

EURJPY Wave Analysis 24 April 2024
April 24, 2024 @ 21:40 +03:00