

Technical analysis
NZDCAD Wave Analysis 5 March, 2021
March 05, 2021 @ 18:45 +03:00

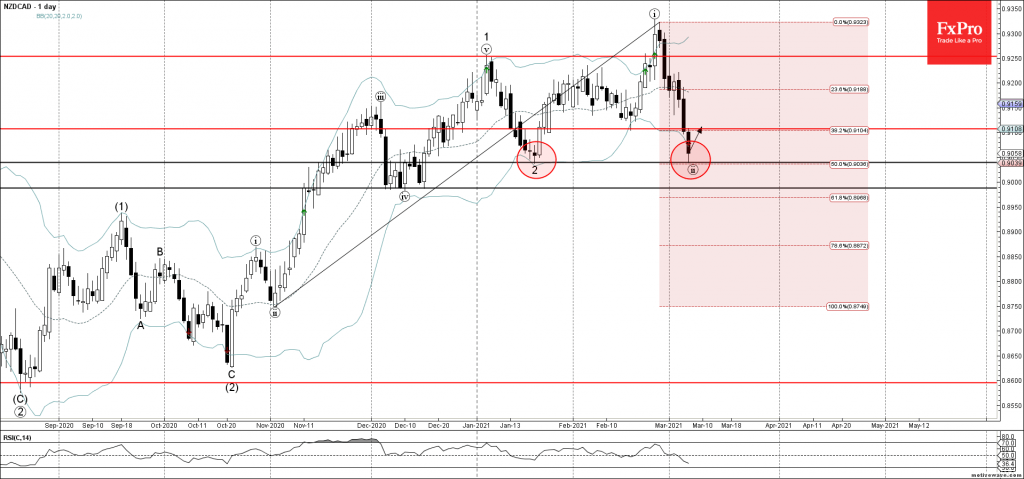
• NZDCAD reversed from key support level 0.9040
• Likely to rise to resistance 0.9100
NZDCAD recently reversed up from the key support level 0.9040 (former monthly low from the middle of January).
The support level 0.9040 stands at the precise intersection of the lower daily Bollinger Band and the 50% Fibonacci correction of the previous upward impulse from November.
NZDCAD is likely to rise further toward the next resistance 0.9100 (former monthly low from February).
Related Articles

Intel Wave Analysis 19 April 2024
April 19, 2024 @ 22:12 +03:00

GBPUSD Wave Analysis 19 April 2024
April 19, 2024 @ 22:11 +03:00

EURJPY Wave Analysis 18 April 2024
April 18, 2024 @ 23:09 +03:00

EURUSD Wave Analysis 18 April 2024
April 18, 2024 @ 23:08 +03:00