

Technical analysis
NZDCAD Wave Analysis – 29 August, 2019
August 30, 2019 @ 16:31 +03:00

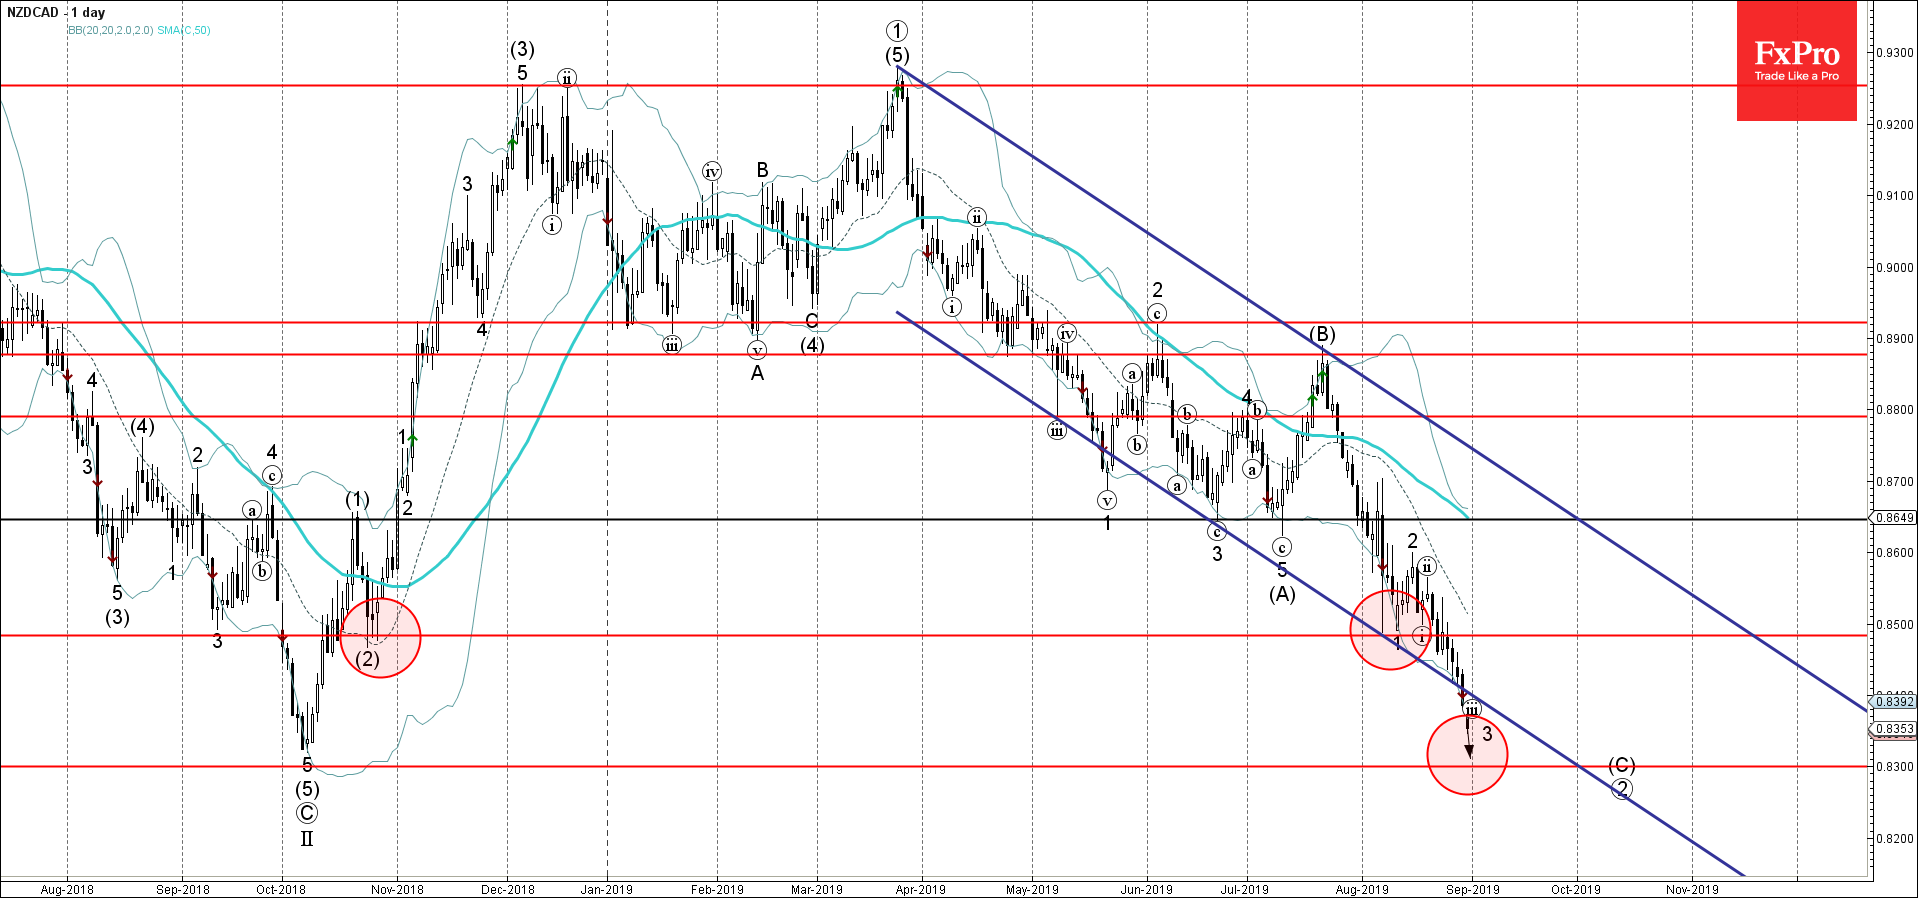
- NZDCAD broke daily down channel
- Further losses are likely
NZDCAD recently broke below the support trendline of the extended daily down channel from March – which encloses the active long-term ABC correction ②.
The breakout of this down channel follows the earlier breakout of the key support level 0.8500 – which stopped the previous impulse wave 1.
NZDCAD is expected to fall further and retest the next support level 0.8300 (target price for completion of active ABC correction ②).
Related Articles

EURGBP Wave Analysis 24 April 2024
April 24, 2024 @ 21:42 +03:00

EURJPY Wave Analysis 24 April 2024
April 24, 2024 @ 21:40 +03:00

WTI crude oil Wave Analysis 23 April 2024
April 23, 2024 @ 22:47 +03:00

USDCAD Wave Analysis 23 April 2024
April 23, 2024 @ 22:46 +03:00