

NZDCAD Wave Analysis 28 December, 2020
December 28, 2020 @ 17:58 +03:00

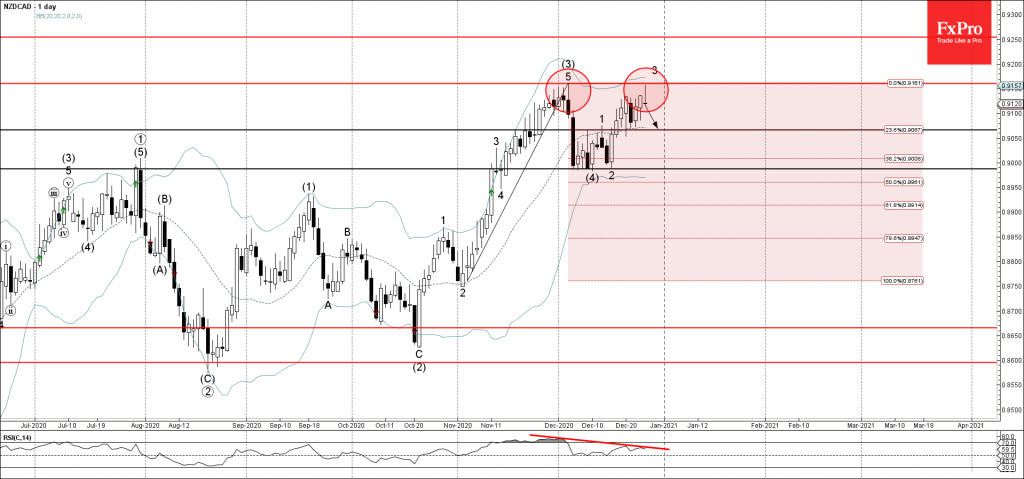
• NZDCAD reversed from key resistance level 0.9160
• Likely to fall to 0.9065
NZDCAD recently reversed down from the key resistance level 0.9160 (which stopped the sharp upward impulse wave (3) at the start of December) – strengthened by the upper daily Bollinger Band.
The downward reversal from the resistance level 0.9160 is likely to create the daily Shooting Star – if the pair closes today near the active levels.
Given the strength of the resistance level 0.9160 and the bearish divergence on the daily RSI indicator – NZDCAD is expected to fall further toward the next support level 0.9065 (former minor resistance from the start of December).

April 18, 2024 @ 23:09 +03:00

April 18, 2024 @ 23:08 +03:00

April 17, 2024 @ 22:40 +03:00

April 17, 2024 @ 22:38 +03:00