

NZDCAD Wave Analysis 26 October, 2020
October 26, 2020 @ 18:21 +03:00

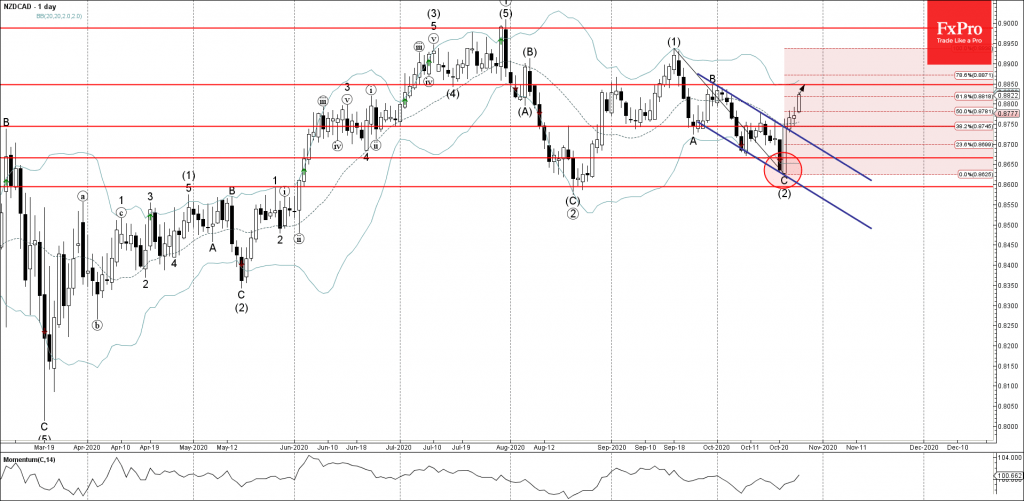
• NZDCAD rising inside impulse wave (3)
• Likely to rise to 0.8850
NZDCAD continues to rise inside the medium-term impulse wave (3) which started earlier from the support area lying between the support levels 0.8600 (former multi-month low from August), lower daily Bollinger band and the support trendline of the daily down channel from September.
The price earlier broke the upper resistance trendline of the aforementioned down channel from September – which accelerated the active impulse wave (3).
NZDCAD is likely to rise further toward the next resistance level 0.8850 (top of the previous minor correction B from the end of September).

April 23, 2024 @ 22:47 +03:00

April 23, 2024 @ 22:46 +03:00

April 19, 2024 @ 22:12 +03:00

April 19, 2024 @ 22:11 +03:00