

Technical analysis
NZDCAD Wave Analysis – 20 August, 2020
August 20, 2020 @ 17:20 +03:00

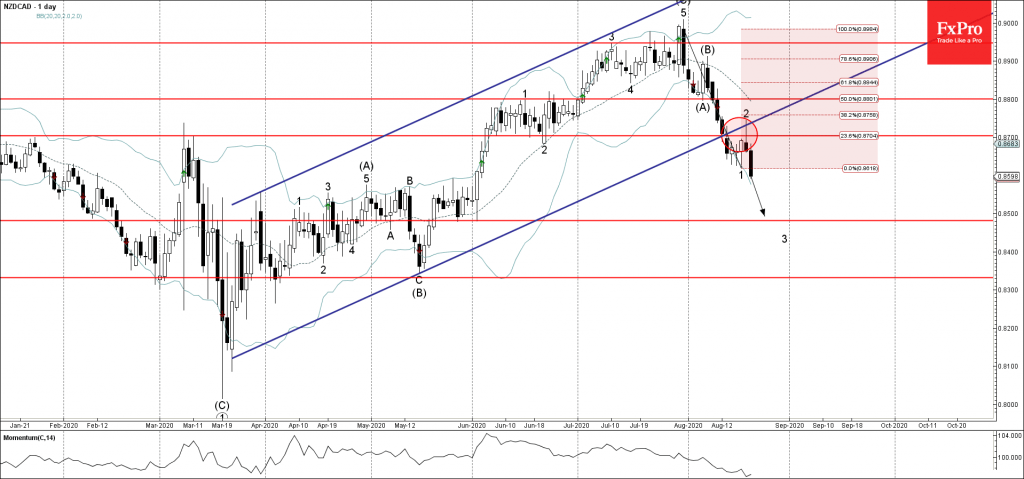
• NZDCAD reversed from resistance level 0.8700
• Likely to fall to 0.8500
NZDCAD recently reversed down from the resistance level 0.8700 (former support from June), intersecting with the lower trendline of the daily up channel from the middle of March.
The downward reversal from the resistance level 0.8700 created the daily reversal pattern Shooting Star – which started the active short-term impulse wave 3.
NZDCAD is likely to fall further toward the next support level 0.8500 (likely price for the completion of the active impulse wave 3).
Related Articles

EURGBP Wave Analysis 24 April 2024
April 24, 2024 @ 21:42 +03:00

EURJPY Wave Analysis 24 April 2024
April 24, 2024 @ 21:40 +03:00

WTI crude oil Wave Analysis 23 April 2024
April 23, 2024 @ 22:47 +03:00

USDCAD Wave Analysis 23 April 2024
April 23, 2024 @ 22:46 +03:00