

Technical analysis
NZDCAD Wave Analysis – 18 October, 2019
October 18, 2019 @ 15:12 +03:00

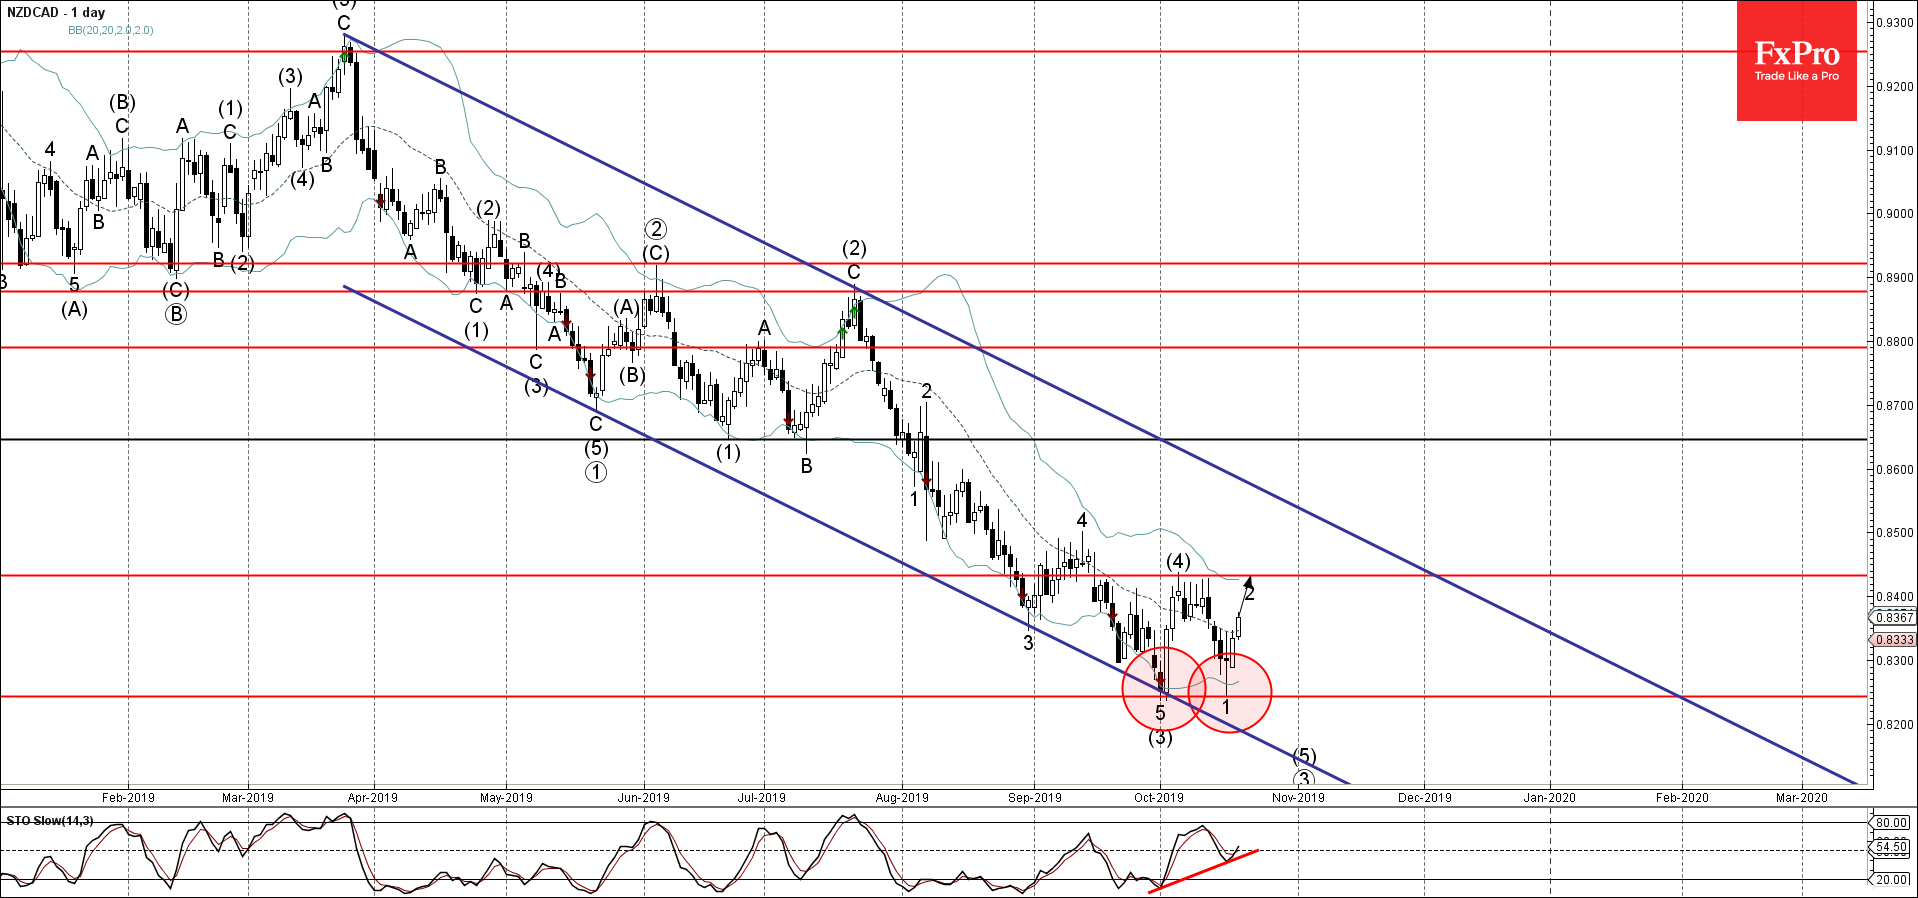
- NZDCAD reversed from support area
- Likely to rise to 0.8430
NZDCAD recently reversed up from the support area lying between the pivotal support level 0.8240 and the lower daily Bollinger Band.
The upward reversal from this support area created the daily Japanese candlesticks reversal pattern Morning Star.
NZDCAD is expected to rise further and retest the next resistance level 0.8430 (top of the previous corrective wave (4)).
Related Articles

EURJPY Wave Analysis 18 April 2024
April 18, 2024 @ 23:09 +03:00

EURUSD Wave Analysis 18 April 2024
April 18, 2024 @ 23:08 +03:00

WTI Wave Analysis 17 April 2024
April 17, 2024 @ 22:40 +03:00

EURGBP Wave Analysis 17 April 2024
April 17, 2024 @ 22:38 +03:00