

Technical analysis
NZDCAD Wave Analysis – 17 September, 2020
September 17, 2020 @ 17:52 +03:00

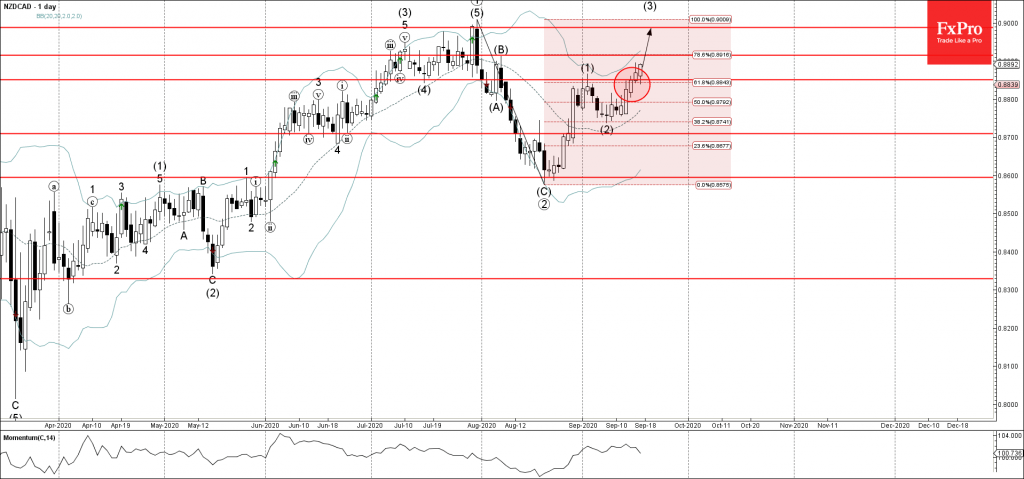
• NZDCAD broke resistance area
• Likely to rise to 0.8915 and 0.9000
NZDCAD recently broke resistance area located between the resistance level 0.8850 (which stopped the previous impulse wave (1)) and the 61.8% Fibonacci correction of the downward correction from July.
The breakout of this resistance area continues the active medium-term impulse wave (3) from the start of September.
NZDCAD is likely to rise further toward the next resistance level 0.8915 (top of wave (B) from the start of August) – the breakout of which can lead to further gains toward the powerful resistance 0.9000.
Related Articles

Intel Wave Analysis 19 April 2024
April 19, 2024 @ 22:12 +03:00

GBPUSD Wave Analysis 19 April 2024
April 19, 2024 @ 22:11 +03:00

EURJPY Wave Analysis 18 April 2024
April 18, 2024 @ 23:09 +03:00

EURUSD Wave Analysis 18 April 2024
April 18, 2024 @ 23:08 +03:00