

Technical analysis
NZDCAD Wave Analysis 11 December, 2020
December 11, 2020 @ 18:21 +03:00

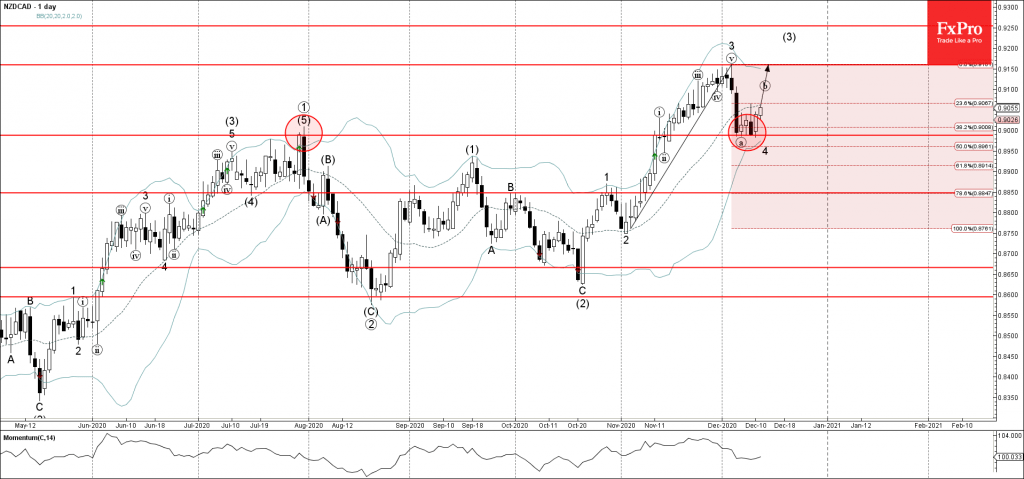
• NZDCAD reversed from support level 0.9000
• Likely to rise to 0.9150
NZDCAD recently reversed up from the round support level 0.9000 (former powerful resistance level from July, acting as support after it was broken last month).
The support area near the support level 0.9000 was strengthened by the lower daily Bollinger Band and by the 38.2% Fibonacci correction of the upward impulse wave 3 from November. NZDCAD is expected to rise further toward the next resistance level 0.9150 (top of the previous impulse wave 3).
Related Articles

EURJPY Wave Analysis 18 April 2024
April 18, 2024 @ 23:09 +03:00

EURUSD Wave Analysis 18 April 2024
April 18, 2024 @ 23:08 +03:00

WTI Wave Analysis 17 April 2024
April 17, 2024 @ 22:40 +03:00

EURGBP Wave Analysis 17 April 2024
April 17, 2024 @ 22:38 +03:00