

Technical analysis
NZDCAD Wave Analysis 10 March, 2021
March 10, 2021 @ 18:48 +03:00

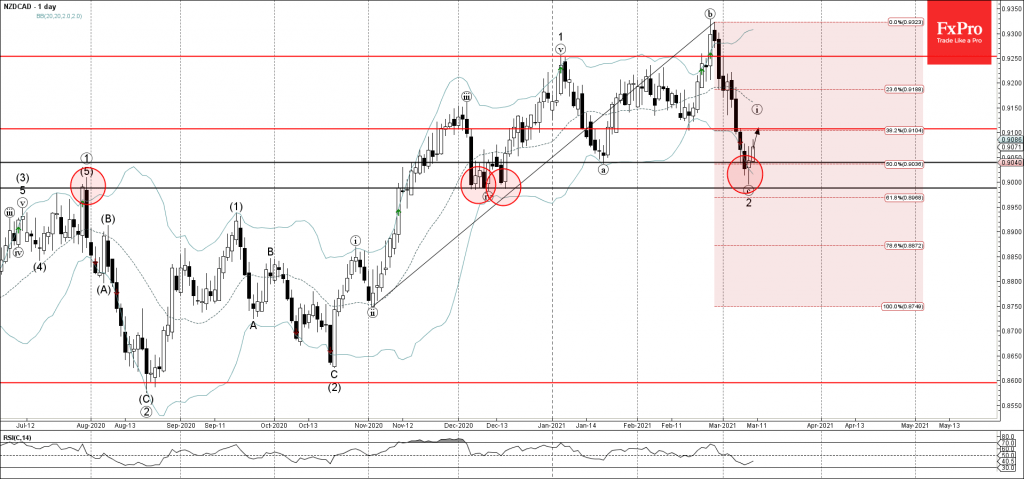
• NZDCAD reversed from support level 0.9000
• Likely to reach resistance level 0.9100
NZDCAD recently reversed up from the round support level 0.9000 (which reversed the pair multiple times in December) – standing outside of the the lower daily Bollinger Band and intersecting with the 61.8% Fibonacci correction of the upward impulse from November.
The upward reversal from the support level 0.9000 started the active short-term impulse wave 3.
NZDCAD is likely to rise further toward the next resistance level 0.9100 (former monthly low from February).
Related Articles

EURGBP Wave Analysis 24 April 2024
April 24, 2024 @ 21:42 +03:00

EURJPY Wave Analysis 24 April 2024
April 24, 2024 @ 21:40 +03:00

WTI crude oil Wave Analysis 23 April 2024
April 23, 2024 @ 22:47 +03:00

USDCAD Wave Analysis 23 April 2024
April 23, 2024 @ 22:46 +03:00