

Technical analysis
Natural gas Wave Analysis – 30 July, 2020
July 30, 2020 @ 17:49 +03:00

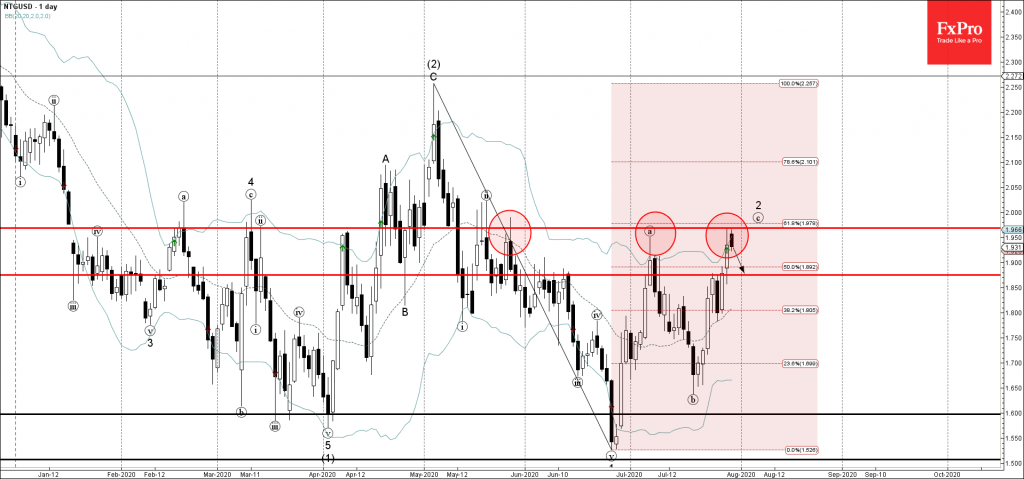
• Natural gas reversed from resistance zone
• Likely to fall to 1,8750
Natural gas recently reversed down from the key resistance zone lying between the resistance level 1,965 (which has been reversing the price from May), upper daily Bollinger Band and the 61,8% Fibonacci correction of the previous downward impulse 1 from May.
The downward reversal from this resistance zone stopped the earlier short-term impulse wave (c).
Natural gas is likely to correct down to the next support level 1,8750 (former minor resistance from last week).
Related Articles

Intel Wave Analysis 19 April 2024
April 19, 2024 @ 22:12 +03:00

GBPUSD Wave Analysis 19 April 2024
April 19, 2024 @ 22:11 +03:00

EURJPY Wave Analysis 18 April 2024
April 18, 2024 @ 23:09 +03:00

EURUSD Wave Analysis 18 April 2024
April 18, 2024 @ 23:08 +03:00