

Technical analysis
Natural Gas Wave Analysis – 26 December, 2019
December 26, 2019 @ 10:29 +03:00

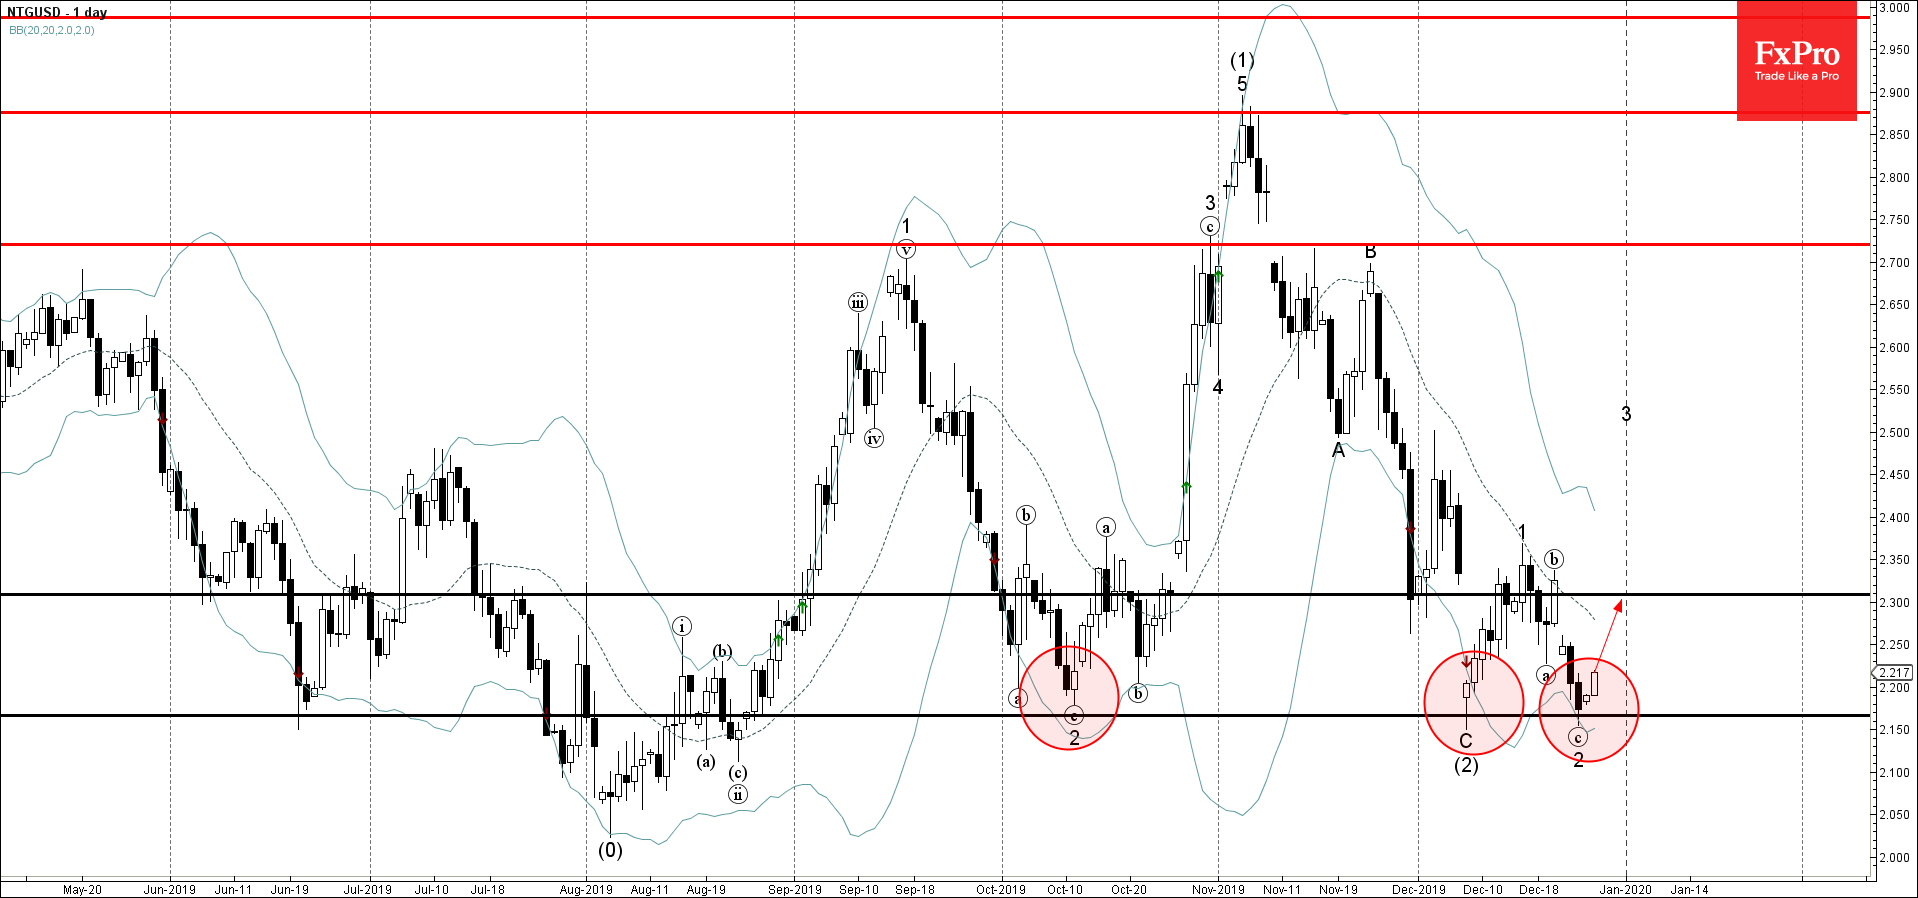
- Natural Gas reversed from support area
- Likely to rise to 2.300
Natural Gas recently reversed up from the support area lying between the pivotal support level 2.166 (which has been reversing the price from October) and the lower daily Bollinger Band.
The upward reversal from this support area started the active short-term impulse wave 3 – which belongs to the longer-term impulse sequence (3) – which started from the same support area.
Natural Gas is expected to rise further toward the next resistance level 2.300 (which reversed the pervious wave (b) earlier this month).
Related Articles

EURGBP Wave Analysis 24 April 2024
April 24, 2024 @ 21:42 +03:00

EURJPY Wave Analysis 24 April 2024
April 24, 2024 @ 21:40 +03:00

WTI crude oil Wave Analysis 23 April 2024
April 23, 2024 @ 22:47 +03:00

USDCAD Wave Analysis 23 April 2024
April 23, 2024 @ 22:46 +03:00