

Technical analysis
Natural gas Wave Analysis – 15 September, 2020
September 15, 2020 @ 17:17 +03:00

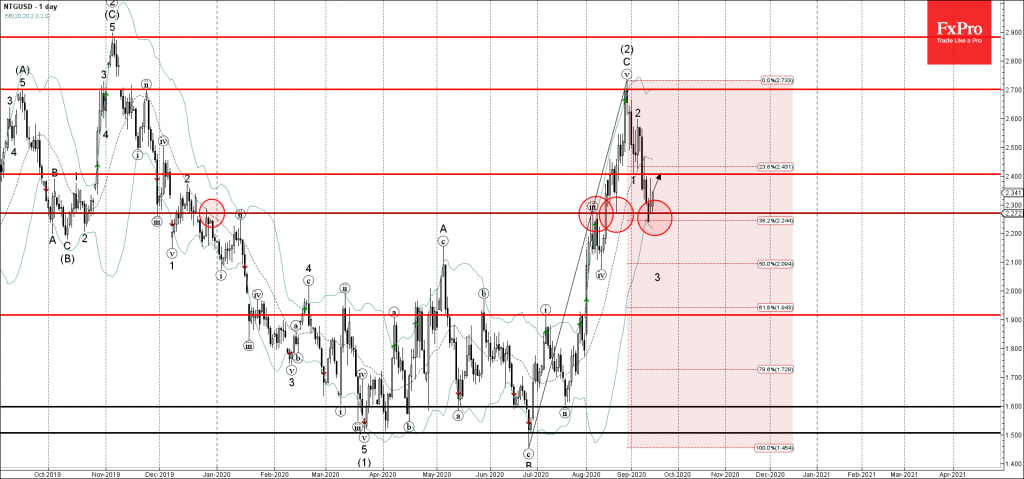
• Natural gas reversed from support level 2.270
• Likely to rise to 2.400
Natural gas recently reversed up from the support level 2.270 (former resistance from August) – standing near the lower daily Bollinger Band and the 38.2% Fibonacci correction of the upward wave C from June.
The price yesterday formed the daily Long Legged Doji near the support level 2.270 indicating its strength.
Natural gas is likely to rise further toward the next resistance level 2.400 (former strong support which ended the previous impulse wave 1 at the start of September).
Related Articles

WTI crude oil Wave Analysis 23 April 2024
April 23, 2024 @ 22:47 +03:00

USDCAD Wave Analysis 23 April 2024
April 23, 2024 @ 22:46 +03:00

Intel Wave Analysis 19 April 2024
April 19, 2024 @ 22:12 +03:00

GBPUSD Wave Analysis 19 April 2024
April 19, 2024 @ 22:11 +03:00